MS 150 Statistics Spring 2003 Mx • Name: _____________________
Out for a run!
Basic statistics
On Wednesday evening I jogged home from the College. As I jogged I kept track of my time as I passed various points at known distances. When I got home I checked my pace on each leg of the jog. The following table records my pace on each leg.
Pace in minutes per km per leg
| End point | Pace |
|---|
| Mount Dolon | 6.35 |
| First bridge | 5.92 |
| Third bridge | 5.47 |
| Sokehs junction | 6.92 |
| 6-11 Junction | 7.50 |
| Dolihner | 8.72 |
- __________ Find the sample size n for the pace per leg data.
- __________ Find the minimum pace.
- __________ Find the maximum pace.
- __________ Find the range of the pace.
- __________ Find the median pace.
- __________ Find the mode for the pace.
- __________ Find the sample mean pace.
- __________ Find the sample standard deviation pace.
- __________ Find the sample coefficient of variation CV.
- __________ If this data were to be divided into five bins, what would be the width of a single bin?
Frequencies, histograms, and probabilities
- Lee Ling's paces were calculated for 32 legs and recorded in the table below. Complete this table using the data given in the table. Calculate the relative frequency and the mean pace at which Lee Ling jogs.
Pace Legs
| bins | Freq | RF or P(x) | Mean calc |
|---|
| 5.38 | 3 | __________ | __________ |
| 6.00 | 5 | __________ | __________ |
| 6.63 | 14 | __________ | __________ |
| 7.26 | 6 | __________ | __________ |
| 7.88 | 4 | __________ | __________ |
| Sums: | __________ | __________ | __________ |
|---|
Mean pace at which Lee Ling jogs: _______________
- Sketch a relative frequency histogram of the data here or
on the back, labeling your horizontal axis and vertical axis as
appropriate.
- __________ What is the shape of the distribution?
- __________ Determine P(x <= 5.38 minutes per kilometer)
- __________ Determine P(6.00 < x <= 6.63 minutes per kilometer)
- __________ What is the probability of rolling a four or a six on an eight sided die?
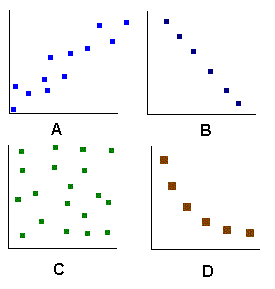
 Linear relationships and regressions
Matching
- __________ Negative linear relationship
- __________ Positive linear relationship
- __________ Non-linear relationship
- __________ Random, no relationship
Linear regression
On the Wednesday evening jog home I logged the following distance versus time data:
Time vs distance Wednesday evening jog
| Location | Time/min | Dist/km |
|---|
| College | 0.00 | 0.0 |
| Mount Dolon | 20.97 | 3.3 |
| First bridge | 28.67 | 4.6 |
| Third bridge | 34.13 | 5.6 |
| Sokehs junction | 54.90 | 8.6 |
| 6-11 Junction | 60.90 | 9.4 |
| Dolihner | 63.52 | 9.7 |
- __________ Calculate the slope of the linear trend line (also known as best fit line, least squares, linear regression) for the time versus distance data.
- __________ Calculate the y-intercept for the data.
- __________ Is the correlation positive, negative, or neutral?
- __________ Determine the correlation coefficient
- __________ Is the correlation none, low, moderate, high, or perfect?
- __________ Determine the coefficient of determination.
- __________ What percent in the variation in time explains the variation in distance?
- __________ Based on the equation of the trend line, what would be the
predicted distance for a 45 minute jog?
- __________ Based on the equation of the trend line, what would be the predicted time for a 2 kilometer jog?
- __________ Based on the equation of the trend line, what would be the
time for a 80 kilometer jog?
| Statistic or Parameter |
Symbol |
Equations |
Excel |
| Square root |
|
|
=SQRT(number) |
| Sample mean |
x |
Σx/n |
=AVERAGE(data) |
| Sample standard deviation |
sx |
|
=STDEV(data) |
| Sample Coefficient of Variation |
CV |
100(sx/x |
=100*STDEV(data)/AVERAGE(data) |
| Slope |
b |
|
=SLOPE(y data, x data) |
| Intercept |
a |
|
=INTERCEPT(y data, x data) |
| Correlation |
r |
|
=CORREL(y data, x data) |
| Coefficient of Determination |
rČ |
|
=(CORREL(y data, x data))^2 |
__________ Do you use the textbook?
__________ Do you find the textbook to be helpful?
What would be your comments on changing from using the textbook to having the students purchase bound copies of the class notes from the bookstore for next Fall?
 Linear relationships and regressions
 Linear relationships and regressions