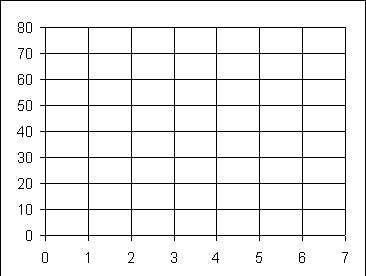
Quickie Quiz 4
- Graph the following data on the graph seen further below. The data was provided by
the Micronesian seminar and is the pass rate on the College entrance examination.
| x: Year (1994=0) |
y: PNI Pass Rate |
| 0 |
40 |
| 1 |
29 |
| 2 |
41 |
| 3 |
42 |
| 4 |
69 |
| 5 |
69 |
| 6 |
75 |
- Find the slope of the best fit line through the data.
_______________________
- Find the intercept the best fit line through the data.
_______________________
- Sketch a best fit line through the data based on the slope and intercept.
_______________________
- Calculate the correlation coefficient r.
_______________________
- Plot the following Chuuk State data on the same graph above.
| Year (1994=0) |
Chuuk Pass Rate |
| 0 |
29 |
| 1 |
23 |
| 2 |
23 |
| 3 |
16 |
| 4 |
24 |
| 5 |
28 |
| 6 |
27 |
- Calculate the correlation coefficient r for the Chuuk data
______________________
- Which state shows a steady improvement in pass rates?
_______________________
- Which state shows a pass rate that fluctuates randomly year to year?
_______________________
Lee Ling home
COM-FSM home page