MS 150 Statistics Fall 2000 Midterm Examination Lee Ling
| Statistic |
Equations |
Excel |
| Mean |
=  = x P(x) = n p = x P(x) = n p |
=AVERAGE(data) |
| Sample Standard Deviation |
= sx
=  |
=STDEV(data) |
| Population Standard Deviation |
= 
=  |
|
| Slope |
|
=SLOPE(y data, x data) |
| Intercept |
|
=INTERCEPT(y data, x data) |
| Correlation |
|
=CORREL(y data, x data) |
| Binomial probability |
= nCr pr q(n-r) |
=COMBIN(n,r)*p^r*q^(n-r) |
 Linear Regression
A student in SC 250 Botany notes that the Kalanchoe plant puts out one pair of leaves
every month. The student also observes that the leaf blade continues to grow during the
twelve month life span of a leaf blade. The student decides to study the leaf blade length
and to determine statistical measures for the blades and their growth rate. The student
gathers the following data:
| Leaf blade age in months (x) |
Leaf blade length in cm (y) |
| 2 |
16.0 |
| 3 |
16.5 |
| 4 |
15.5 |
| 5 |
17.0 |
| 6 |
17.3 |
| 7 |
17.2 |
| 8 |
17.2 |
| 9 |
17.0 |
| 10 |
18.4 |
| 11 |
18.0 |
| 12 |
18.5 |
- What level of measurement is the leaf blade length data?
- _______ What is the mean leaf blade length
 in centimeters?
- _______ What is the median leaf blade length in centimeters?
- _______ What is the mode of the leaf blade length in centimeters?
- _______ What is the leaf blade length sample standard deviation sy in centimeters?
- _______ What is the leaf blade length Coefficient of Variation?
- Explain what the Coefficient of Variation means in the above situation?
- _______ The slope of the least squares line represents the average rate of leaf blade
growth per month in centimeters. What is the slope of the least squares line?
- _______ Use the least squares equation to predict the length of a leaf blade that is
10.5 months old.
- _______ Use the least squares equation to predict the age of a leaf blade that is 17.4
cm long.
- _______ The Pearson product-moment correlation will indicate whether the growth can be
reasonably modeled by a linear equation. What is the correlation r for the above
data?
- Is the correlation...
- perfect negative correlation
- highly negative correlation
- moderately negative correlation
- no correlation
- moderately positive correlation
- highly positive correlation
- perfect positive correlation
- _______ What is the Coefficient of Determination r² for the data above?
- What does the Coefficient of Determination tell us for this model?
- _______ Is the growth rate reasonably well modeled by a linear equation?
- Why?
- What does the y-intercept value of the least squares line represent physically for the
above data?
Probability Distribution
Grade Point
Value (x) |
Female |
P(x) |
x P(x) |
(x-mean)²P(x) |
| 4 |
5638 |
» |
» |
» |
| 3 |
5070 |
» |
» |
» |
| 2 |
4473 |
» |
» |
» |
| 1 |
2311 |
» |
» |
» |
| 0 |
3995 |
» |
» |
» |
|
» |
» |
» |
» |
|
|
|
|
» |
At the national campus over the past five years the distribution of grades as measured
by the grade points for women is given in the table above. The second row of the table can
be read in the following manner: "5,638 women at the national campus obtained a grade
of A (Grade Point Value of 4) over the past five years." The other rows can be
read in a similar manner. A grade point value of 0 results from grades of W, F, and
I.
- Calculate the probability distribution (the relative frequencies) for each grade point
value and record the results in the table above.
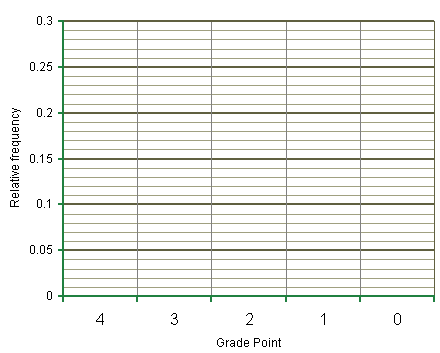
- Make a histogram of the probability distribution (relative frequency histogram)

- What is the shape of the distribution?
- _______ Based on the data, what is the probability that a randomly selected female
student in a class will have a grade of "A" (a grade point of 4) in the class?
- _______ Calculate P(1 or 0).
- _______ Calculate the mean of the distribution.
- _______ Calculate the population standard deviation of the data.
- _______ The data shown below is the distribution of grades by grade points for men at
the national campus over the past five years. Determine the mean grade point for the
men from this data.
| Grade Point Value (x) |
Male |
x P(x) |
| 4 |
5403 |
» |
| 3 |
5238 |
» |
| 2 |
5004 |
» |
| 1 |
2782 |
» |
| 0 |
4957 |
» |
|
» |
» |
- _______ Who has the higher grade point average at the College, women or men?
Binomial probability
- A math entrance test has 70 multiple choice questions. Each question has five
possible answers, only one is correct. What is the probably that randomly chosen
answers will result in getting 14 correct?
Lee Ling home
COM-FSM home page
 Linear Regression