The graph shows soap density data. Use the graphed data to answer the following questions.
__________ _____ Calculate the density ρ of Dial Basic soap.
______________ Based on the density, will Dial Basic soap floatorsink?
__________ _____ Using the density above, calculate the mass of a bar of Dial Basic soap that has a volume of 100 cm³.
__________ _____ Using the density above, calculate the volume of a bar of Dial Basic soap that has a mass of 250 grams.
__________ _____ Calculate the density ρ of Ivory soap.
______________ Based on the density, will Ivory soap floatorsink?
__________ _____ Calculate the density ρ of Neutrana soap.
______________ Critical thinking: Based on the density, will Neutrana soap floatorsink?
A student gathered the data seen in the table below.
Plot the soap data on the graph.
__________ __________ Calculate the density of the soap. Include the units with your answer.
______________ Based on the slope, will this soap [float]OR[sink]?
______________ Based on the slope, is this soap likely to be [Ivory]OR[Dial] soap?
__________ __________ Calculate the mass for this soap for a volume of 200 cm³.
__________ __________ Calculate the volume for this soap for a mass of 240 g.
Critical thinking: Some laboratory groups obtained slopes which incorrectly predicted whether their soap would float or sink. Which are they more likely to have measured incorrectly and WHY: the volume or the mass?
For the following RipStik velocity chart:
__________ _____ Determine the velocity ѵ of the RipStik.
__________ _____ If the RipStik continued at that velocity for 30 seconds, how many centimeters would the RipStik travel?
__________ _____ If the RipStik continued at that velocity for 5700 centimeters, how many seconds would the RipStik travel?
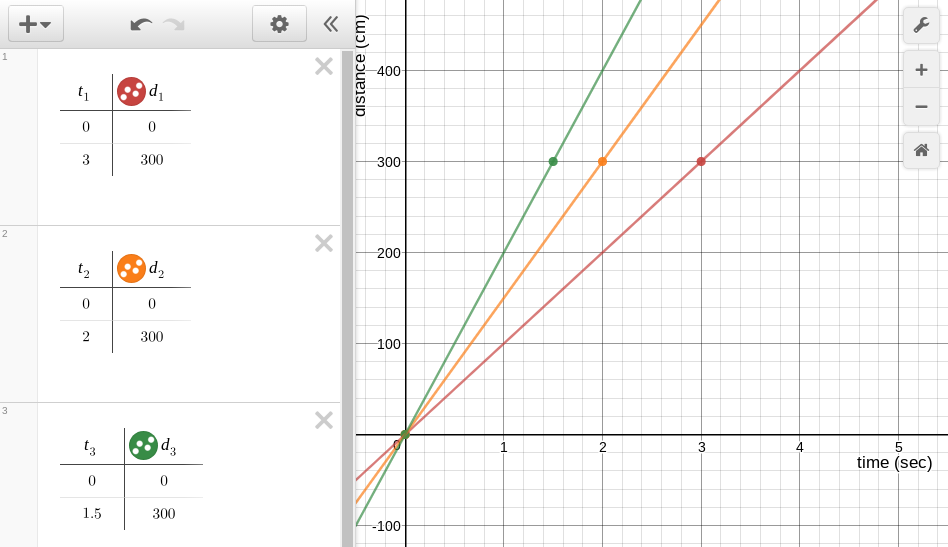
A RipStik moved at three different velocities (speeds). The data was gathered in the tables and plotted on the graph seen below.
__________ __________ Calculate the velocity (speed) for the first table (red line).
__________ __________ Calculate the velocity (speed) for the second table (orange line).
__________ __________ Calculate the velocity (speed) for the third table (green line).
__________ Which RipStik run is the fastest: red, orange, or green?
__________ Which RipStik run is the slowest: red, orange, or green?
__________ __________ How far will the red data RipStik travel in 36 seconds?
__________ __________ How long in seconds for red data RipStik to travel 5000 centimeters?
The five graphs seen below plot time versus distance for a rolling ball. Time in seconds is on the x-axis. Distance in centimeters is on the y-axis.
Explain what is happening with the speed of ball A.
Explain what is happening with the speed of ball B.
Explain what is happening with the speed of ball C.
Explain what is happening with the speed of ball D.
Explain what is happening with the speed of ball E.
Volume V = length l × width w × height h
mass m = density ρ × Volume V