The first graph plots data from a soap density measurement laboratory. The slope of the line is the density of the soap.
__________ Calculate the slope of the line.
______________ Determine the y-intercept of the line.
y = _________ x + __________ Write the y = mx + b slope-intercept equation for the line.
[float] or [sink] The slope of the line is the density of soap. If the density of the soap is less than one gram/centimeter³ then the soap would float. If the density of the soap is greater than one gram/centimeter³ then the soap would sink. Based on the above, will this soap float or sink?
A student gathered the data seen in the table below. Plot the data on the graph.
__________ Calculate the slope of the line.
__________ Calculate the intercept of the line.
__________ cm. How far will the RipStik travel in 23 seconds?
__________ seconds. How long in seconds for the RipStik to travel 7500 centimeters?
__________ What is the slope of the line y = 2.0 + 0.15x?
__________ What is the y-intercept of the line y = 2.0 + 0.15x?
The graph shows soap density data. Use the graphed data to answer the following questions.
__________ _____ Calculate the density ρ of Dial Basic soap.
______________ Based on the density, will Dial Basic soap floatorsink?
__________ _____ Using the density above, calculate the mass of a bar of Dial Basic soap that has a volume of 160 cm³.
__________ _____ Using the density above, calculate the volume of a bar of Dial Basic soap that has a mass of 250 grams.
__________ _____ Calculate the density ρ of Ivory soap.
______________ Based on the density, will Ivory soap floatorsink?
__________ _____ Calculate the density ρ of Neutrana soap.
______________ Critical thinking: Based on the density, will Neutrana soap floatorsink?
For the following RipStik velocity chart (note that the RipStik starts from 500 cm!):
__________ _____ Determine the velocity ѵ of the RipStik.
__________ _____ If the RipStik continued at that velocity for 30 seconds, how many centimeters would the RipStik travel?
__________ _____ If the RipStik continued at that velocity for 5600 centimeters, how many seconds would the RipStik travel?
Fastlynn ran 24200 centimeters in 88 seconds.
__________ _____ Calculate Fastlynn's speed in centimeters per second.
_______________ Is Fastlynn faster or slower than 202 cm/s speed of the RipStik on Monday 22 August?.
__________ seconds. How long in seconds for Fastlynn to run 100,000 centimeters (equals one kilometer)?
The time versus distance for two runs of a RipStik were recorded in the table below.
Plot the data using circles and squares for A and B respectively.
__________ __________ Calculate the velocity for RipStik run A.
__________ __________ Calculate the velocity for RipStik B from 0 to 2 seconds.
__________ __________ Calculate the velocity for RipStik B from 2 to 4 seconds.
__________ __________ Based on the above two calculations, by how much did the velocity increase for RipStik B?
__________ __________ Calculate the average acceleration of RipStik B over the four seconds from 0 to 4 seconds by dividing the change in velocity by four seconds.
__________ __________ The curve on the graph is the acceleration of RipStik. Using the point D (5 seconds, 800 cm) and the equation d = ½at², calculate the acceleration of the RipStik.
Thursday laboratory measurement of the acceleration of gravity:
__________ _____ What was the acceleration of gravity that you measured on Thursday?
___________________ Given that the actual acceleration of gravity is g = 980 cm/s², was your experimentally measured value for the acceleration of gravity too high or too low?
A student rolled marbles into a line of five marbles.
_________ If one marble collides with a line of five marbles on a ruler track, how many marbles are ejected (go out)?
_________ If three marbles collide with a line of five marbles on a ruler track, how many marbles are ejected (go out)?
When a RipStik rolls down hill...
☐ The RipStik rolls at a constant rate of speed.
☐ The RipStik rolls less than twice as fast from twice as high.
☐ The RipStik rolls twice as fast from twice as high.
☐ The RipStik rolls more than twice as fast from twice as high.
The chart below has three height versus distance functions plotted, each labelled by a letter: A, B, or C. Match the function by letter to the description below.
___ With increasing height, the velocity increases at an increasing rate.
___ With increasing height, the velocity increases at a constant rate.
___ With increasing height, the velocity increases at a decreasing rate.
___ Which of these functions depicts what really happened on Monday: A, B, or C?
My Corona EXiV car has a mass of 1150 kg. Driving at the state speed limit of 11.1 m/s (that is forty kilometers per hour), calculate the following:
__________ __________ ...the momentum p of the car.
__________ __________ ...the kinetic energy KE of the car.
A marble with a mass of 5.0 grams is 40 centimeters above a table on a banana leaf marble ramp. The marble is released and rolls down the ramp onto the table. Use an acceleration of gravity g equal to 980 cm/s² for this question.
__________ __________ Calculate the Gravitational Potential Energy of the marble before the marble is released.
__________ __________ Determine the Kinetic Energy that the marble should have at the bottom of the ramp.
__________ __________ Calculate the velocity that the marble should have at the bottom of the ramp.
__________ In the laboratory using an actual marble and banana leaf, will the marble have the speed you just calculated?
__________ Will the actual marble be fasterORslower?
Provide definitions for the following:
Newton's first law of motion.
Newton's second law of motion.
Newton's third law of motion.
What are the following temperatures in Celsius?
_________℃ Ice melts/water freezes.
_________℃ Coconut oil melts/freezes.
_________℃ Typical daily indoor room temperature in Pohnpei.
_________℃ Healthy living human body core temperature.
_________℃ Water boils.
Explain the difference between heat and temperature.
In general, what types of materials conduct heat?
In general, what types of materials do not conduct heat?
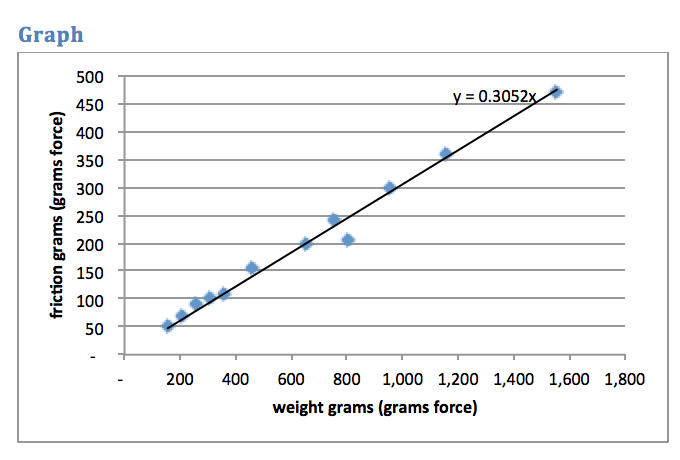
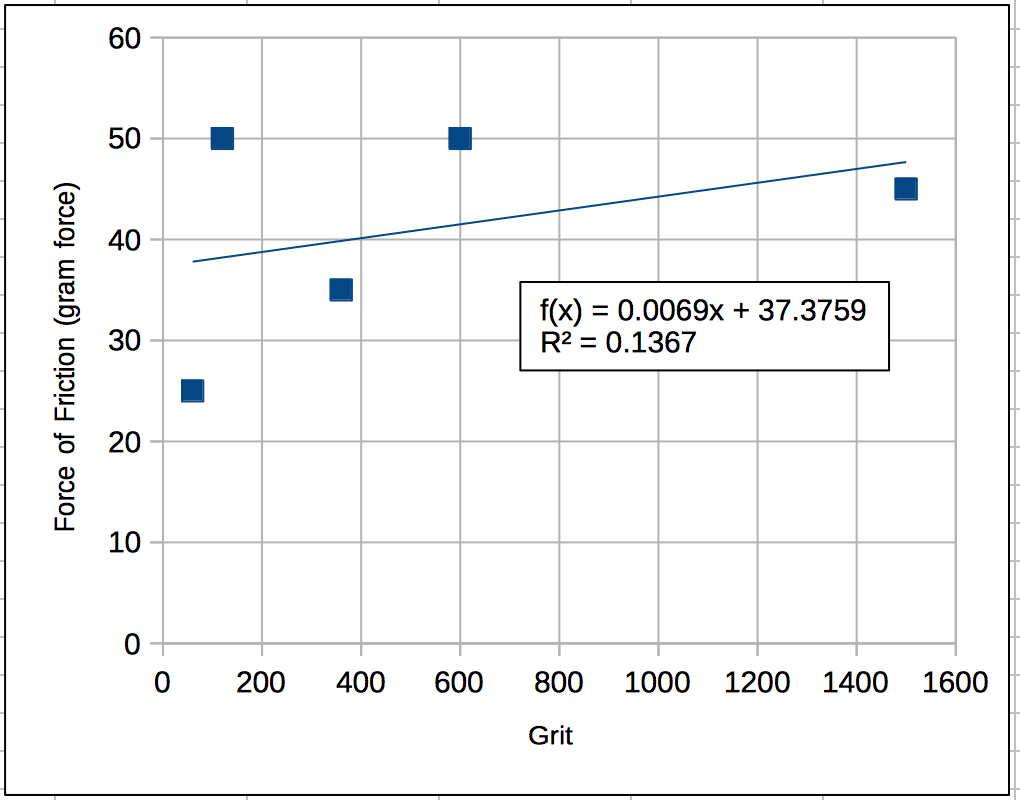
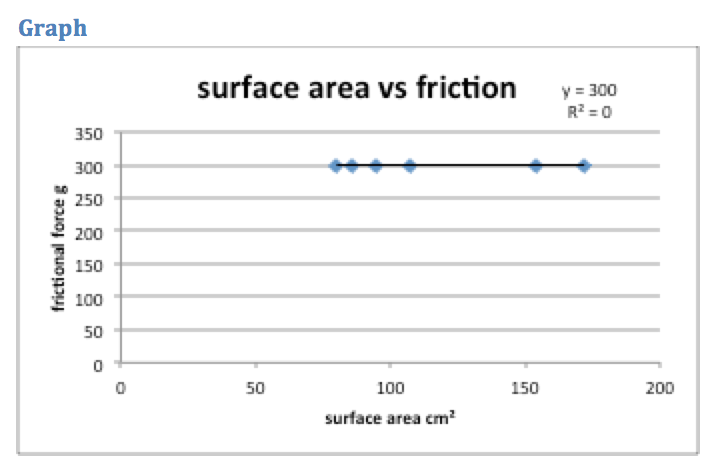
The graphs show force of friction data for weight, grit, and surface area from presentations on Friday.
Weight: force = 0.3052×weight
Grit: force = 0.0069×grit + 37.37
Surface area: force = 0.000×surface area + 300
_______________ Based on the data gathered and shared in class, which variable has the most effect on the force of friction?
______________ __________ If a weight of 1000 grams were put on the glass sled used to generate the weight graph, what would be the force of friction?
Define latitude:
Define longitude:
Which way do lines of longitude run on campus? Describe!
_________ _____ The classroom is at E 158° 09.651'. I hid at E 158° 09.314'. Calculate the difference in arcminutes between the classroom and where I was hiding.
_________ _____ The classroom is at E 158° 09.651'. I hid at E 158° 09.314'. Use a value of 1842 meters per arcminute to calculate the distance in meters from the classroom to where I was hiding.
☁ ________________________
☁ ________________________
☁ ________________________
Concepts from videos: What is precipitation?
Explain what happens to sea surface temperatures in the western Pacific during an El Niño.
Explain what happens to sea surface temperatures in the western Pacific during an La Niña.
What is the difference between weather and climate?
Concepts from presentations: Give a brief definition of the term El Niño
Give a brief definition of the term La Niña
Give a brief definition of the term ENSO-neutral.
Explain the meaning and the significance of SOI with respect to El Niño. Which values indicate El Niño, which indicate La Niña, which indicate neutral conditions?
Give a brief overview of the sea level trends over the past four years and the current sea level situation.
A wave was inscribed on poster paper by a RipStik. The RipStik was timed and took 0.75 seconds to go from 0 cm to 162 cm.
On the diagram above, label a crest.
On the diagram above, label a trough.
λ = _________ _________ What is the wavelength λ of ONE wave?
a = _________ _________ What is the amplitude a?
τ = _________ _________ What is the period τ of ONE wave?
f = _________ _________ What is the frequency f?
ѵwave = _________ _________ What is the wave velocity ѵwave?
A student gathered the data seen in the table below.
Plot the data on the graph.
__________ __________ Calculate the experimental speed of sound based on the data. Include the units with your answer.
__________ __________ The published value for the speed of sound that day was 348 m/s. Calculate the raw error for this data.
__________The published value for the speed of sound that day was 348 m/s. Calculate the percentage error for this data.
__________ __________ Using a a speed of sound of 340 m/s, if thunder follows lighting by 10 seconds, how far away is the lighting in meters?
Write out the full names of the seven colors of the Newtonian rainbow IN ORDER:
What is the scientific name for the spread of colors that was seen in the box with the CD?
List the three primary colors of light:
List the three secondary colors of light:
Hue Saturation Luminosity (HSL) colors:
Define Hue:
Define Saturation:
Define Luminosity:
________________ What color of light does an orange pumpkin reflect?
________________ What color of light does an orange pumpkin absorb?
As noted in class, indigo was added to the rainbow by Newton to generate a seven color rainbow. Looking at a spectrum, however, there really is no visually different color at the position of indigo. If indigo were to be replaced, what color would you add to the other six rainbow colors, the spectrum, and why?
Describe in your own words retinex theory.
______________ ______________ _____________ What does the acronym LCD stand for?
What is an AMOLED display and what are the advantages to an AMOLED display?
What is a Quantum Dot LCD display and what advantages does the quantum dot display have?
Define reflection.
Define refraction.
Define total internal reflection.
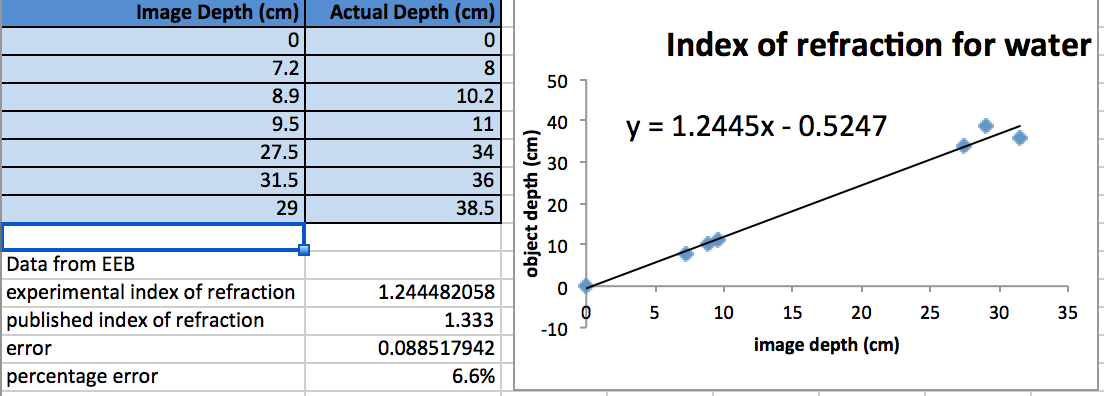
______________ Based on the data below, what is the index of refraction for water?
A student gathered the data seen in the table below.
______________ Calculate the slope of the line. The slope is the experimental index of refraction for water.
______________ __________ Use the slope above to predict the object depth for a penny that appears to be 30 cm underwater.
______________ __________ Use the slope above to predict the image depth for a coral head that is 200 cm underwater.
______________ Water has a published index of refraction of 1.33. What is the error for the slope?
______________ Water has a published index of refraction of 1.33. What is the percentage error for the slope?
A Whirlpool dryer uses 26 amps of current at 240 volts.
__________ _____ Calculate the resistance R for the dryer.
__________ _____ Calculate the power P for the dryer.
__________ What is the atomic number of Zn?
__________ What is the atomic mass of Zn?
__________ How many protons does Zn have?
__________ How many neutrons does Zn have?
__________ How many electrons does Zn have?
____________________ Zn was an element tested in the electrical conductivity, what is the full name for Zn?
[Note that in an atom the number of neutrons is equal to or greater than the number of protons. Thus the more numerous nucleons are the neutrons.]
_______________ Looking only at the atomic diagram on this paper, determine the atomic number of the atom depicted.
_______________ Looking at the diagram, what is the atomic mass for the atom?
_______________ Looking at the diagram and the chart on the wall, what is the one or two letter chemical abbreviation for this element?
_______________ What is the common name for compound with the formula H2O?
_______________ In general, what color do acids tend to turn floral pigment fluids?
_______________ In general, what color do bases tend to turn floral pigment fluids?
_______________ Are lime fruits acid, base, or neutral?
_______________ Is vinegar an acid, base, or neutral?
_______________ Is cream of tartar an acid, base, or neutral?
_______________ Is water an acid, base, or neutral?
_______________ Is baking soda an acid, base, or neutral?
_______________ Is ammonia an acid, base, or neutral?
_______________ Is a bar of hand soap an acid, base, or neutral?
_______________ Is laundry detergent an acid, base, or neutral?
_______________ Is bleach an acid, base, or neutral?
Draw a diagram on the back with protons, neutrons, and electrons for HF (hydrofluoric acid, a compound of Hydrogen and Fluorine).
The graph displays three data sets for three different mathematical models. One data set is plotted as squares, one as circles, and a third as triangles.
__________ Which shape plots data modeled by a linear mathematical trend line model?
__________ Which shape plots data modeled by a non-linear mathematical trend line model?
__________ Which shape plots data that is randomly distributed and cannot be modeled by a trend line model?
__________ For the data that plots linearily, make a mathematical estimate of the slope.
__________ For the data that plots linearily, make a mathematical estimate of the y-intercept.
____________________ What mathematical model, if any, does your flying disk or ball data appear to obey?
In the summer of 2016 students gathered data on all four flying objects: balls, disks, rings, and the Aerobie. Based on the following data and chart:
Which object flies the "best" - the farthest for a given launch velocity?
Based on the data and chart, what tells you that this is object flies the best?
Which object flies the "worst" - the shortest for a given launch velocity?
Based on the data and chart, what tells you that this is object flies the worst?
List the full name of the planets in order from the star Sol outwards.
Draw a picture for a child of the ball pattern for the site swap equation 3333333333...
Draw a picture for a child of the ball pattern for the site swap equation 5151515151...
error = experimental value − expected value
distance d = velocity ѵ × time t
ѵ = at ѵ = gt d = ½at² d = ½gt²
where g is the acceleration of gravity g = 980 cm/s²
Gravitational Potential Energy GPE = mgh
Kinetic Energy KE = ½mѵ²
momentum p = mass m × velocity ѵ
Force F = mass m × acceleration a
period τ = 1 ÷ (period τ)
frequency f = 1 ÷ (frequency f )
velocity ѵ = wavelength λ * frequency f
Voltage V = current i * resistance R
Power P = iV