The first graph plots data from a soap density measurement laboratory. The slope of the line is the density of the soap.
__________ Calculate the slope of the line.
______________ Determine the y-intercept of the line.
y = _________ x + __________ Write the y = mx + b slope-intercept equation for the line.
____________________________ Write the units of measurement for the x-axis.
____________________________ Write the units of measurement for the y-axis.
____________________________ Write the units of measurement for the slope.
A student gathered the data seen in the table below.
Plot the data.
__________ Calculate the slope of the line.
__________ Calculate the intercept of the line.
__________ cm. How far will the RipStik travel in 23 seconds?
__________ seconds. How long in seconds for the RipStik to travel 7500 centimeters?
__________ What is the slope of the line y = 2.0 + 0.15x?
__________ What is the y-intercept of the line y = 2.0 + 0.15x?
The graph shows soap density data. Use the graphed data to answer the following questions.
__________ _____ Calculate the density ρ of Dial Basic soap.
______________ Based on the density, will Dial Basic soap floatorsink?
__________ _____ Using the density above, calculate the mass of a bar of Dial Basic soap that has a volume of 100 cm³.
__________ _____ Using the density above, calculate the volume of a bar of Dial Basic soap that has a mass of 250 grams.
__________ _____ Calculate the density ρ of Ivory soap.
______________ Based on the density, will Ivory soap floatorsink?
__________ _____ Calculate the density ρ of Neutrana soap.
______________ Critical thinking: Based on the density, will Neutrana soap floatorsink?
Critical thinking: Some laboratory groups obtained slopes which incorrectly predicted whether their soap would float or sink. Which are they more likely to have measured incorrectly and explain WHY: the volume or the mass?
A student gathered the data seen in the table below.
Plot the soap data on the graph.
__________ __________ Calculate the density of the soap. Include the units with your answer.
Based on the slope, will the soap [float]OR[sink]?
Based on the slope, is this likely to be [Ivory]OR[Dial] soap?
For the following RipStik velocity chart:
__________ _____ Determine the velocity ѵ of the RipStik.
__________ _____ If the RipStik continued at that velocity for 30 seconds, how many centimeters would the RipStik travel?
__________ _____ If the RipStik continued at that velocity for 5700 centimeters, how many seconds would the RipStik travel?
A RipStik moved at three different velocities (speeds). The data was gathered in the table seen below.
Plot the data using circles, squares, and diamonds for A, B, and C respectively.
__________ __________ Calculate the velocity (speed) of RipStik run A.
__________ __________ Calculate the velocity (speed) of RipStik run B.
__________ __________ Calculate the velocity (speed) of RipStik run C.
__________ Which RipStik run is the fastest (A, B, or C)?
__________ Which RipStik run is the slowest (A, B, or C)?
__________ __________ How far will RipStik A travel in 36 seconds?
__________ __________ How long in seconds for RipStik A to travel 5100 centimeters?
When a young typhoon develops hot towers of rapidly rising warm air, what will happen to the strength of the typhoon?
What is the importance of the sinking salty brine water under the ice of Antarctica?
The Bodele depression of the Sahara desert in Africa contains rich deposits of the plant nutrient phosphate. How does this phospate wind up fertilizing trees in the rain forests of Brazil, South America?
The following time versus data was obtained during a Tuesday morning RipStik acceleration run.
__________ Based on the graph is the RipStik going faster and faster?
__________ __________ Use the data provided and the formula to calculate the velocity of the RipStik from 0 to 1 second.
__________ __________ Use the data provided and the slope formula to calculate the velocity of the RipStik from 9 to 10 seconds.
__________ __________ Using the equation d = ½gt² and an acceleration of gravity g = 980 cm/s², calculate the distance a ball will fall in one second.
__________ __________ Using the equation d = ½gt² and an acceleration of gravity g = 980 cm/s², calculate the length of time in seconds for the ball to fall 100 cm.
My Corona EXiV car has a mass of 1150 kg. Driving at the state speed limit of 11.1 m/s, calculate the following:
__________ __________ ...the momentum p of the car using p = mѵ.
__________ __________ ...the kinetic energy KE of the car using KE = ½mѵ².
The chart below has three functions plotted, each labelled by a letter: A, B, or C. Use the shape to match the function by letter to the description below.
___ Time versus distance for a RipStik moving at a constant velocity.
___ Time versus distance for an accelerating RipStik.
___ Height versus speed for a marble on a marble leaf ramp.
A marble with a mass of 5.0 grams is 40 centimeters above a table on a banana leaf marble ramp. The marble is released and rolls down the ramp onto the table. Use an acceleration of gravity g equal to 980 cm/s² for this question.
__________ __________ Calculate the Gravitational Potential Energy of the marble before the marble is released using GPE = mgh
__________ __________ Use the law of the conservation of energy to report the kinetic energy that the marble should have at the bottom of the ramp if there is no friction.
__________ __________ Calculate the velocity that the marble should have at the bottom of the ramp using the equation KE = ½mѵ² if there is no friction.
__________ In the laboratory using an actual marble and banana leaf, will the marble have the speed you just calculated?
__________ Will the actual marble be fasterORslower?
A student rolled marbles into a line of five marbles.
_________ If one marble collides with a line of five marbles on a ruler track, how many marbles are ejected (go out)?
_________ If three marbles collide with a line of five marbles on a ruler track, how many marbles are ejected (go out)?
Write out Newton's first law of motion.
Write out Newton's second law of motion.
Write out Newton's third law of motion.
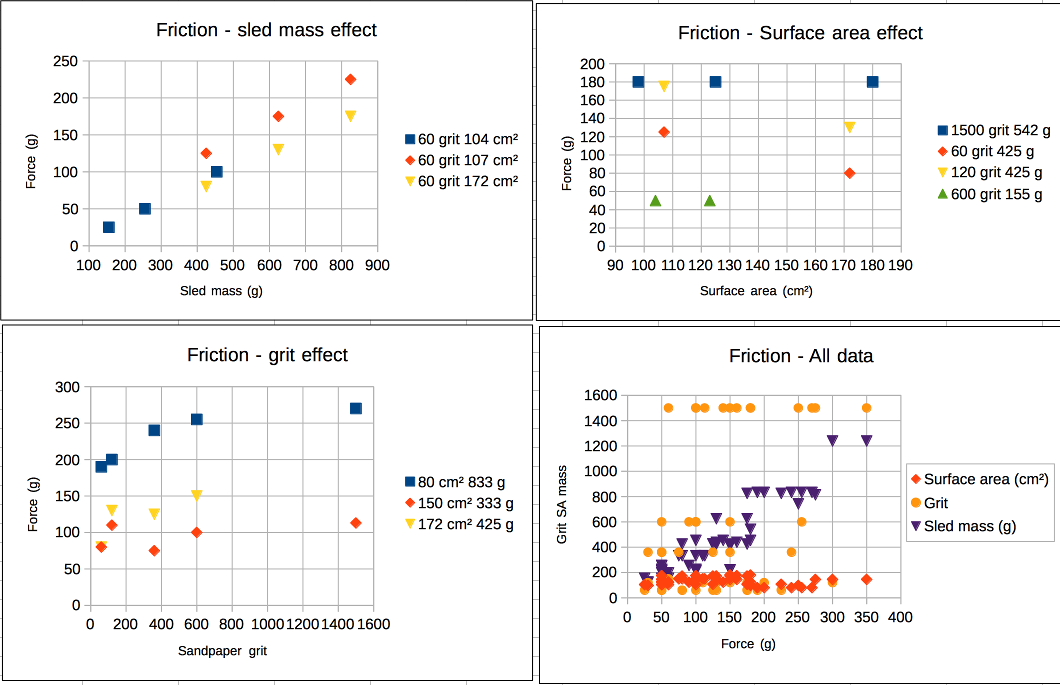
For reference, the graphs show force of friction data gathered by the students in SC 130 for surface area, grit, and mass.
According to the data you gathered in the laboratory on Thursday, which variable had the most effect: sandpaper grit, surface area, or the mass of the glass sled?
According to the data you gathered in the laboratory on Thursday, which variable had the least effect: sandpaper grit, surface area, or the mass of the glass sled?
The graph shows soap density data. Use the graphed data to answer the following questions.
__________ _____ Calculate the density ρ of Dial Basic soap.
______________ Based on the density, will Dial Basic soap floatorsink?
__________ _____ Using the density above, calculate the mass of a bar of Dial Basic soap that has a volume of 100 cm³.
__________ _____ Using the density above, calculate the volume of a bar of Dial Basic soap that has a mass of 250 grams.
__________ _____ Calculate the density ρ of Ivory soap.
______________ Based on the density, will Ivory soap floatorsink?
__________ _____ Calculate the density ρ of Neutrana soap.
______________ Critical thinking: Based on the density, will Neutrana soap floatorsink?
For the following RipStik velocity chart (note the equation has changed!):
__________ _____ Determine the velocity ѵ of the RipStik.
__________ _____ If the RipStik continued at that velocity for 30 seconds, how many centimeters would the RipStik travel?
__________ _____ If the RipStik continued at that velocity for 7500 centimeters, how many seconds would the RipStik travel?
A RipStik moved at three different velocities (speeds). The data was gathered in the table seen below.
Plot the data using circles, squares, and diamonds for A, B, and C respectively.
__________ __________ Calculate the velocity (speed) of RipStik run A.
__________ __________ Calculate the velocity (speed) of RipStik run B.
__________ __________ Calculate the velocity (speed) of RipStik run C.
__________ __________ How far will RipStik A travel in 36 seconds?
__________ __________ How long in seconds for RipStik A to travel 5100 centimeters?
When a young typhoon develops hot towers of rapidly rising warm air, what will happen to the strength of the typhoon?
What is the importance of the sinking salty brine water under the ice of Antarctica?
The Bodele depression of the Sahara desert in Africa contains rich deposits of the plant nutrient phosphate. How does this phospate wind up fertilizing trees in the rain forests of Brazil, South America?
Explain the difference between heat and temperature.
_________________ When solids and liquids heat up, do they expandorconract?.
The following time versus data was obtained during a Tuesday morning RipStik acceleration run.
__________ __________ What was the speed of the RipStik at time t = 0 seconds?
__________ __________ Use the data provided and the slope formula to calculate the velocity (speed) of the RipStik from 9 to 10 seconds.
__________ __________ Using the velocity at t = 0 seconds from a) above and the velocity of the RipStik from 9 to 10 second from b) above, calculate the acceleration of the RipStik.
__________ __________ Using the equation d = ½gt² and an acceleration of gravity g = 980 cm/s², calculate the distance a ball will fall in one second.
__________ __________ Using the equation d = ½gt² and an acceleration of gravity g = 980 cm/s², calculate the length of time in seconds for the ball to fall 100 cm.
A marble with a mass of 5.0 grams is 160 centimeters above a table on a banana leaf marble ramp. The marble is released and rolls down the ramp onto the table. Use an acceleration of gravity g equal to 980 cm/s² for this question.
__________ __________ Calculate the Gravitational Potential Energy of the marble before the marble is released using GPE = mgh
__________ __________ Calculate the velocity that the same marble should have at the bottom of the ramp using the equation KE = ½mѵ² if there is no friction.
A student rolled marbles into a line of five marbles.
Why are the marbles in generally equal to the marbles out?
For balls swinging from a pendulum the number in is equal to the number out. For marbles this is generally but not exactly true. What is different about the marbles that complicates the "number in" being equal to "the number out"?
Write out Newton's first law of motion.
Write out Newton's second law of motion.
Write out Newton's third law of motion.
For reference, the graphs show force of friction data gathered by the students in SC 130 for surface area, grit, and mass.
__________ Calculate a reasonable estimate of the slope of the best fit trend line for the sled mass (g) versus the Force (g).
For part a) above, what are the units?
Temperatures in Celsius:
_________℃ What is the temperature of a mix of melting ice and water?
_________℃ What is the typical daily in Pohnpei?
_________℃ What is the temperature of the healthy living human body?
_________℃ What is the temperature of a boiling water?
Define latitude:
Define longitude:
______________
When walking straight North, which number would change on the GPS unit,
the N 06° 54.538'or the E 158° 09.663' number?
On Wednesday we started the search for Binky at a drain grating near room A101.
_________ _____ The drain grating is at E 158° 09.663'. Binky was at E 158° 09.319'. Calculate the difference in arc minutes between the drain grating and Binky.
Use the difference in arc minutes from part a) and the published value of 1842 meters per arc minute of longitude here on Pohnpei to calculate the distance in meters from the grating to Binky.
The following data is adapted from laboratory seven.
___________ ____________ Determine the slope of the line.
___________ ____________ Use the slope to calculate the number of meters for 10 arcminutes.
___________ ____________ Use the slope to calculate the number of meters for 0.001 arcminutes.
___________ ____________ Use the slope to calculate the number of arcminutes for 5000 meters.
What is precipitation?
Explain what happens to sea surface temperatures in the Pacific during an El Niño.
Explain what happens to sea surface temperatures in the Pacific during an La Niña.
What is the difference between weather and climate?
_____________ and _____________. At what local times does the Pohnpei weather service office launch their weather balloons?
What measurements are made by the weather balloon?
A wave was inscribed on poster paper by a RipStik. The RipStik was timed and took 0.75 seconds to go from 0 cm to 162 cm.
On the diagram above, label a crest.
On the diagram above, label a trough.
λ = _________ _________ What is the wavelength λ of ONE wave?
a = _________ _________ What is the amplitude a?
τ = _________ _________ What is the period τ of ONE wave?
f = _________ _________ What is the frequency f?
ѵwave = _________ _________ What is the wave velocity ѵwave?
A student gathered the data seen in the table below.
Plot the data on the graph.
__________ __________ Calculate the experimental speed of sound based on the data. Include the units with your answer.
__________ __________ The published value for the speed of sound that day was 348 m/s. Calculate the raw error for this data.
__________The published value for the speed of sound that day was 348 m/s. Calculate the percentage error for this data.
__________ __________ Based on the experimental data, how long for a sound to travel 6760 meters?
Write out the full names of the seven colors of the Newtonian rainbow IN ORDER:
What is the scientific name for the spread of colors that was seen in the box with the CD?
List the three primary colors of light:
List the three secondary colors of light:
Hue Saturation Luminosity (HSL) colors:
Define Hue:
Define Saturation:
Define Luminosity:
________________ What color of light does an orange ball reflect?
________________ What color of light does an orange ball absorb?
A wave was inscribed on poster paper by a RipStik. The RipStik was timed and took 0.81 seconds to go from 0 cm to 162 cm.
λ = _________ _________ What is the wavelength λ of ONE wave?
a = _________ _________ What is the amplitude a?
τ = _________ _________ What is the period τ of ONE wave?
f = _________ _________ What is the frequency f?
ѵwave = _________ _________ What is the wave velocity ѵwave?
Hue Saturation Luminosity (HSL) colors:
Define Hue:
Define Saturation:
Define Luminosity:
______________ ____________ What gas is the major contributor to climate change and global warming?
What is the cause of this gas being added to the atmosphere?
What is the impact of ocean acidification on coral reefs?
______________ _______ By how much is sea level expected to rise before the end of the century?
______________ _______ What was the temperature increase limit that island nations of the world wanted to see the world commit to at the Paris talks?
______________ _______ What was the temperature increase limit that the world committed to at the Paris talks?
Who is Kathy Jetnil-Kijiner and what does she have to do with climate change?
A student gathered the data seen in the table below.
______________ Calculate the slope of the line. The slope is the experimental index of refraction for water.
______________ __________ Use the slope above to predict the object depth for a penny that appears to be 30 cm underwater.
______________ __________ Use the slope above to predict the image depth for a coral head that is 200 cm underwater.
______________ Water has a published index of refraction of 1.33. What is the error for the slope?
______________ Water has a published index of refraction of 1.33. What is the percentage error for the slope?
The Corning digital hot plate uses 8.7 amperes at 1043 Watts of power.
__________ _____ Calculate the voltage for the hot plate.
__________ _____ Calculate the resistance R for the hot plate.
List two types of alternate energy sources being deployed in Micronesia.
A Whirlpool dryer uses 26 amps of current at 240 volts.
__________ _____ Calculate the resistance R for the dryer.
__________ _____ Calculate the power P for the dryer.
A Haier household refrigerator uses 1.2 amps of current at 115 volts.
__________ _____ Calculate the resistance R for the refrigerator.
__________ _____ Calculate the power P for the refrigerator.
__________ What is the atomic number of C?
__________ What is the atomic mass of C?
__________ How many protons does C have?
__________ How many neutrons does C have?
__________ How many electrons does C have?
____________________ C was an element tested in the electrical conductivity, what is the full name for C?
Remember that the number of neutrons equals or exceeds the number of protons. The number of protons cannot exceed the number of neutrons in a stable element. Thus the more numerous nucleons are the neutrons.
_______________ Looking only at the atomic diagram, determine the atomic number of the atom depicted.
_______________ Looking at the diagram, what is the atomic mass for the atom?
_______________ Looking at the diagram and the chart on the wall, what is the one or two letter chemical abbreviation for this element?
_______________ Looking at the diagram and the chart on the wall, what is the full name for this element?
What is the function of the neutrons in the nucleus?
_______________ What is the common name for compound with the formula H2O?
_______________ In general, what color do acids tend to turn floral pigment fluids?
_______________ In general, what color do bases tend to turn floral pigment fluids?
_______________ Are lime fruits acid, base, or neutral?
_______________ Is vinegar an acid, base, or neutral?
_______________ Is cream of tartar an acid, base, or neutral?
_______________ Is water an acid, base, or neutral?
_______________ Is baking soda an acid, base, or neutral?
_______________ Is ammonia an acid, base, or neutral?
_______________ Is a bar of hand soap an acid, base, or neutral?
_______________ Is laundry detergent an acid, base, or neutral?
_______________ Is bleach an acid, base, or neutral?
Fill in the blanks:
The title of the movie that we watched on Monday was "The Journey to the Edge of the Universe". The journey back to the beginning of time, the moment of creation, begins with a single and simple step. A single step up, just 60 miles up, and we leave the atmosphere of the Earth. Dozens of astronauts have come before us, twelve of those astronauts walked on Earth's nearest satellite, the ___ ___ ___ ___. This video also showed Neil Armstrong's footprints, which may survive million of years maybe longer than us. The narrator also mentioned that our time is limited.
The movie then journeyed to the planet nearest to the Earth. ___ ___ ___ ___ ___ This planet is also called Morning Star, the Evening Star, and a sister to our planet Earth.It is about the same size of our Earth. The clouds are made up sulphuric acid with carbon dioxide. This is one angry Goddess, the air is noxious, unbearable, and hot, approaching 900 degrees. The narrator mention that there is nothing can survive on the planet
The second planet the movie visited was ___ ___ ___ ___ ___ ___ ___. This is a rocky planet with no atmosphere, with the result being that the temperature swings wildly between 800 degrees Fahrenheit during the day and -275 degrees Fahrenheit at night. The core of the planet is a large iron core.
The movie then visited the ___ ___ ___, the star at the center of the solar system, a giant sphere of hydrogen and helium, a nuclear fusion furnace.
The third planet visited was ___ ___ ___ ___ . This planet is the fourth planet from the center of the solar system and is also called the red planet. The planet is red and dead. There is wind and when there is wind then there is air. No ozone layer, nothing to protect any creatures who might choose to live there from deadly space radiation. If they have any. It is hard to believe anything could live here because of the kinds of weather that they have. There was also this the largest volcano in the solar system, Olympus Mons, taller than Mount Everest.
Between the red planet the largest planet in the solar system is the ___ ___ ___ ___ ___ ___ ___ __ belt.
The largest planet in the solar system is the gas giant ___ ___ ___ ___ ___ ___ ___. A giant red spot can be seen, a vast storm larger than the planet earth.
Beyond the largest planet is the "ringed planet," ___ ___ ___ ___ ___ ___. This planet is also a gas giant.
The ringed planet has a moon called ___ ___ ___ ___ ___. There was so much to see in this planet. There is an atmosphere. There is wind, "rain", many different seasons, rivers, lakes, and oceans, that looks familiar and similar to our own planet which is Earth. And yet they are completely different: rives, lakes, and oceans of liquid methane, natural gas, an atmosphere with nitrogen but no oxygen. There is no way life can develop in on this moon of the ringed planet.
Beyond the ringed planet is a planet unknown to the ancients, the planet ___ ___ ___ ___ ___ ___. This is the first planet to be discovered using a telescope. The planet is tipped over at a 98 degree angle, the north pole now facing the sun. 42 years of sunlight will strike the north pole until the sun sets as the planet moves around the sun.
The next planet out is named for the Roman god of the sea, ___ ___ ___ ___ ___ ___ ___. This planet is also a gas giant, but not as large as the largest planet nor the ringed planet. The planet is covered in hydrogen, helium, and methane gas. The planet has very high wind speeds. High winds speeds means that the atmosphere has a lot of kinetic energy. But the planet is too far from the sun for the sun to be the source of the energy. Something else is creating the wind.
Beyond this last planet there are no more "full size" planets. The dwarf planet ___ ___ ___ ___ ___ used to be the "ninth planet" but was demoted and is now called a dwarf planet. The surface appears to be frozen water ice and carbon compounds.
Explain what the following are:
Alpha centuri:
Nebula:
Supernova:
Hypernova:
Black hole:
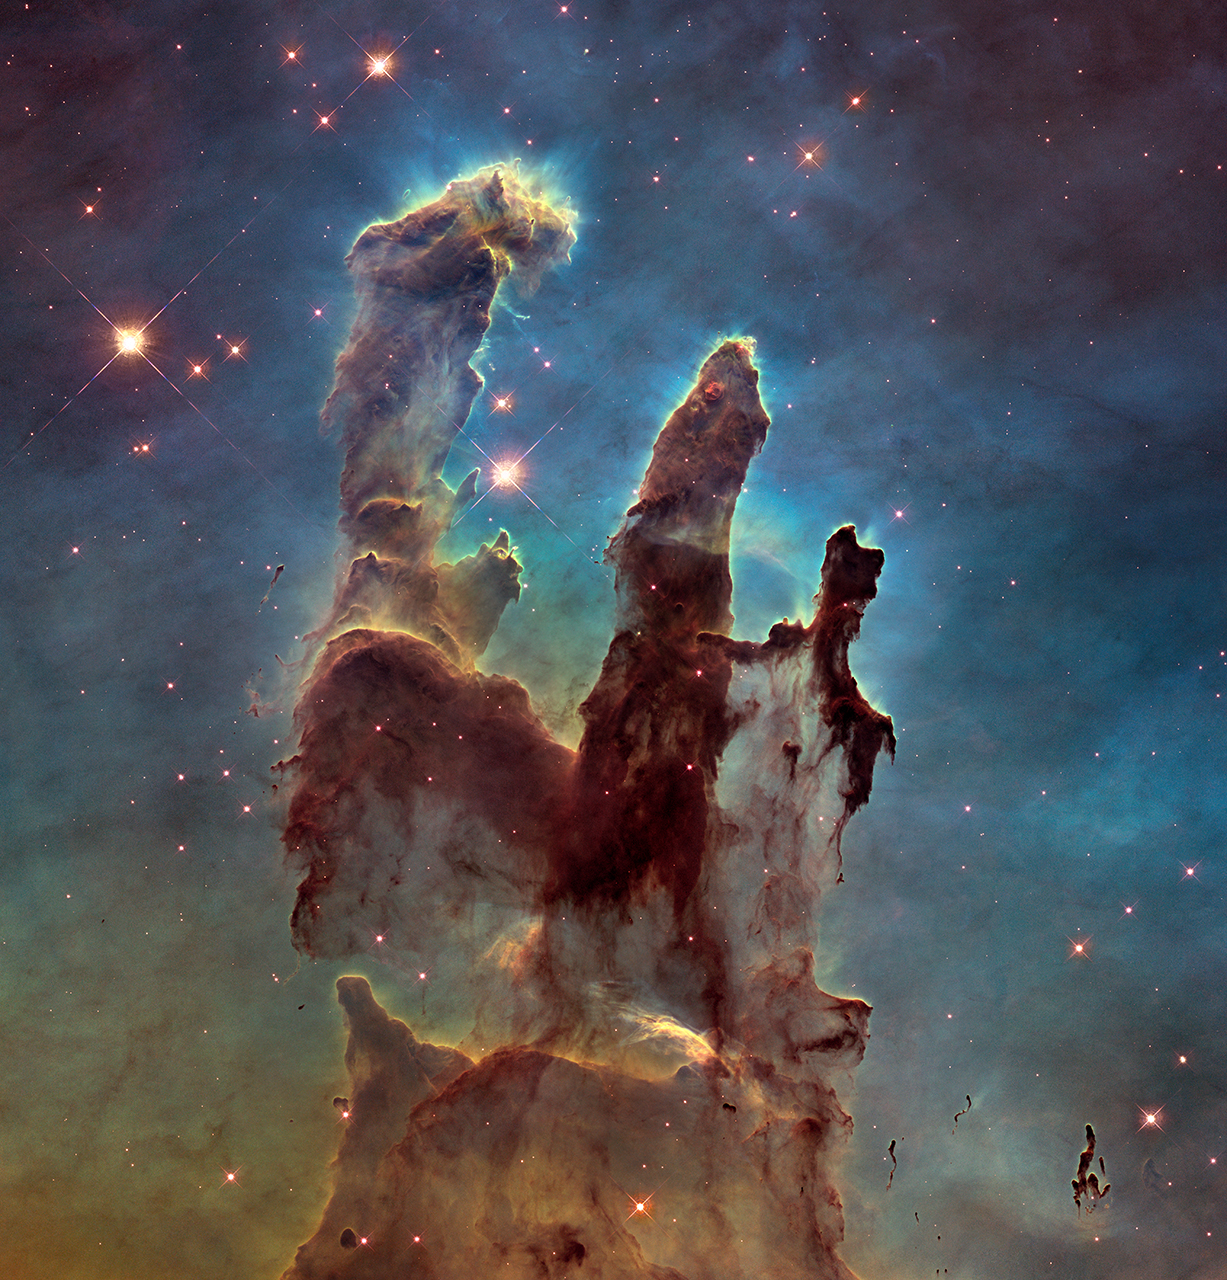
The Pillars of Creation:
Based on the following data and chart:
Which object flies the "best" - the farthest for a given launch velocity?
Based on the data and chart, what tells you that this is object flies the best?
Which object flies the "worst" - the shortest for a given launch velocity?
Based on the data and chart, what tells you that this is object flies the worst?
Atoms are made up of electrons, neutrons, and ______________.
Electrons are very very small. Electrons are so small that they effectively have no inside. Protons and neutrons are larger. Protons and neutrons are made up of ____________.
The positron is the opposite of the electron. The positron has the same size and mass as the electron, but the opposite charge. The positron is made of matter which also the opposite of the matter from which an electron is made. When a positron and electron collide, they annihilate each other. The positron is an example of ______________________.
There are only four forces. The four forces are:
__________________________
______________________________
____________ ______________
________ ______________
The Higgs boson would provide an explanation of why matter has ________.
Vera Rubin studied the rotation speed of ________________.
In Vera Rubin's study did stars farther from the center orbit more slowly as predicted by Newton's laws? ____
When Carlos Frenk ran computer simulations of the universe, galaxies failed to form until dark matter was:
removed
one fifth the amount of visible matter
equal to the amount of visible matter
five times the amount of visible matter
Does dark matter interact with itself? _____
Saul Perlmutter was studying the rate of expansion of the universe. Perlmutter found that the universe is...
... expanding at a rate that is decreasing over time
... expanding at a constant rate over time
... expanding at a rate that is increasing over time
Phantom energy is a hypothetical form of dark energy that is even more potent than the cosmological constant at increasing the expansion of the universe. The remarkable feature is that phantom energy possesses a negative kinetic energy. If it exists, it could cause the expansion of the universe to accelerate so quickly that a scenario known as the ______ ______ would occur.
Draw a picture for a child of the ball pattern for the site swap equation 3333333333...
Draw a picture for a child of the ball pattern for the site swap equation 5151515151...
Volume V = length l × width w × height h
mass m = density ρ × Volume V
distance d = velocity ѵ × time t
velocity ѵ = acceleration a × time t
ѵ = gt d = ½at² d = ½gt²
where g is the acceleration of gravity g = 980 cm/s²
Gravitational Potential Energy GPE = mgh where the acceleration of gravity g = 980 cm/s²
Kinetic Energy KE = ½mѵ²
momentum p = mass m × velocity ѵ
period τ = 1 ÷ (period τ)
frequency f = 1 ÷ (frequency f )
velocity ѵ = wavelength λ * frequency f
raw error = experimental value − published (theoretic) value