The first graph plots data from a soap density measurement laboratory. The slope of the line is the density of the soap.
__________ Calculate the slope of the line.
______________ Determine the y-intercept of the line.
y = _________ x + __________ Write the y = mx + b slope-intercept equation for the line.
____________________________ Write the units of measurement for the x-axis.
____________________________ Write the units of measurement for the y-axis.
____________________________ Write the units of measurement for the slope.
A student gathered the data seen in the table below.
Plot the data.
__________ Calculate the slope of the line.
__________ Calculate the intercept of the line.
__________ cm. How far will the RipStik travel in 23 seconds?
__________ seconds. How long in seconds for the RipStik to travel 7500 centimeters?
__________ What is the slope of the line y = 2.0 + 0.15x?
__________ What is the y-intercept of the line y = 2.0 + 0.15x?
_______________ What math class are you in? If you are not in math this term, what is the highest math class you took?
014
The graph shows soap density data. Use the graphed data to answer the following questions.
__________ _____ Calculate the density ρ of Dial Basic soap.
______________ Based on the density, will Dial Basic soap floatorsink?
__________ _____ Using the density above, calculate the mass of a bar of Dial Basic soap that has a volume of 100 cm³.
__________ _____ Using the density above, calculate the volume of a bar of Dial Basic soap that has a mass of 250 grams.
__________ _____ Calculate the density ρ of Ivory soap.
______________ Based on the density, will Ivory soap floatorsink?
__________ _____ Calculate the density ρ of Neutrana soap.
______________ Critical thinking: Based on the density, will Neutrana soap floatorsink?
Critical thinking: Some laboratory groups obtained slopes which incorrectly predicted whether their soap would float or sink. Which are they more likely to have measured incorrectly and explain WHY: the volume or the mass?
A student gathered the data seen in the table below.
Plot the soap data on the graph.
__________ __________ Calculate the density of the soap. Include the units with your answer.
Based on the slope, will the soap [float]OR[sink]?
Based on the slope, is this likely to be [Ivory]OR[Dial] soap?
024
For the following RipStik velocity chart:
__________ _____ Determine the velocity ѵ of the RipStik.
__________ _____ If the RipStik continued at that velocity for 20 seconds, how many centimeters would the RipStik travel?
__________ _____ If the RipStik continued at that velocity for 8600 centimeters, how many seconds would the RipStik travel?
Tulpe walked 6150 centimeters in 50 seconds.
__________ _____ Calculate Tulpe's speed in centimeters per second.
_______________ Is Tulpe faster or slower than 213 cm/s speed of the RipStik on Monday?.
__________ seconds. How long in seconds for Tulpe to walk 100,000 centimeters?
________ minutes ________ seconds. Convert Tulpe's time to walk 100,000 centimeters from seconds to minutes and seconds.
__________ _____ A runner runs a five kilometer race in 30 minutes. What is their speed in centimeters per second?
A ball was rolled three times at three different velocities (speeds). The data was gathered in the table seen below.
Plot the data using circles, squares, and diamonds for A, B, and C respectively.
__________ __________ Calculate the velocity (speed) of ball run A. Do not forget to include the units!
__________ __________ Calculate the velocity (speed) of ball run B.
__________ __________ Calculate the velocity (speed) of ball run C.
__________ Which ball run is the fastest (A, B, or C)?
__________ Which ball run is the slowest (A, B, or C)?
__________ __________ How far will ball B travel in 23 seconds?
__________ __________ How long in seconds for ball B to travel 6000 centimeters?
034 test one
The graph shows soap density data. Use the graphed data to answer the following questions.
__________ _____ Calculate the density ρ of Dial Basic soap.
______________ Based on the density, will Dial Basic soap floatorsink?
__________ _____ Using the density above, calculate the mass of a bar of Dial Basic soap that has a volume of 100 cm³.
__________ _____ Using the density above, calculate the volume of a bar of Dial Basic soap that has a mass of 250 grams.
__________ _____ Calculate the density ρ of Ivory soap.
______________ Based on the density, will Ivory soap floatorsink?
__________ _____ Calculate the density ρ of Neutrana soap.
______________ Critical thinking: Based on the density, will Neutrana soap floatorsink?
For the following RipStik velocity chart:
__________ _____ Determine the velocity ѵ of the RipStik.
__________ _____ If the RipStik continued at that velocity for 30 seconds, how many centimeters would the RipStik travel?
__________ _____ If the RipStik continued at that velocity for 5600 centimeters, how many seconds would the RipStik travel?
Tulpe walked 6150 centimeters in 50 seconds.
__________ _____ Calculate Tulpe's speed in centimeters per second.
_______________ Is Tulpe faster or slower than 213 cm/s speed of the RipStik on Monday?.
__________ seconds. How long in seconds for Tulpe to walk 160,934 centimeters?
________ minutes ________ seconds. Convert Tulpe's time to walk 100,000 centimeters from seconds to minutes and seconds.
The time versus distance for two runs of a RipStik were recorded in the table below.
Plot the data using circles and squares for A and B respectively.
__________ __________ Calculate the velocity for RipStik run A.
__________ __________ Calculate the velocity for RipStik B from 0 to 2 seconds.
__________ __________ Calculate the velocity for RipStik B from 2 to 4 seconds.
__________ __________ Calculate the change in velocity for RipStik B.
__________ __________ Calculate the average acceleration of RipStik B over the four seconds from 0 to 4 seconds.
__________ __________ The curve on the graph is the acceleration of RipStik. Using the point D (5 seconds, 800 cm) and the equation d = ½at², calculate the acceleration of the RipStik.
__________ _____ Using the equation d = ½gt² and an acceleration of gravity g = 980 cm/s², calculate the distance a ball will fall in one second.
__________ _____ Using the equation d = ½gt² and an acceleration of gravity g = 980 cm/s², calculate the length of time in seconds for the ball to fall 100 cm.
044
When a RipStik rolls down hill...
☐ The RipStik rolls at a constant rate of speed.
☐ The RipStik rolls less than twice as fast from twice as high.
☐ The RipStik rolls twice as fast from twice as high.
☐ The RipStik rolls more than twice as fast from twice as high.
The chart below has three height versus distance functions plotted, each labelled by a letter: A, B, or C. Match the function by letter to the description below.
___ With increasing height, the velocity increases at an increasing rate.
___ With increasing height, the velocity increases at a constant rate.
___ With increasing height, the velocity increases at a decreasing rate.
___ Which of these functions depicts what really happened on Monday: A, B, or C?
My Corona EXiV car has a mass of 1150 kg. Driving at the state speed limit of 11.1 m/s (that is forty kilometers per hour), calculate the following:
__________ __________ ...the momentum p of the car.
__________ __________ ...the kinetic energy KE of the car.
A marble with a mass of 5.0 grams is 40 centimeters above a table on a banana leaf marble ramp. The marble is released and rolls down the ramp onto the table. Use an acceleration of gravity g equal to 980 cm/s² for this question.
__________ __________ Calculate the Gravitational Potential Energy of the marble before the marble is released.
__________ __________ Determine the Kinetic Energy that the marble should have at the bottom of the ramp.
__________ __________ Calculate the velocity that the marble should have at the bottom of the ramp.
__________ In the laboratory using an actual marble and banana leaf, will the marble have the speed you just calculated?
__________ Will the actual marble be fasterORslower?
Why?
A student rolled marbles into a line of five marbles.
_________ If one marble collides with a line of five marbles on a ruler track, how many marbles are ejected (go out)?
_________ If three marbles collide with a line of five marbles on a ruler track, how many marbles are ejected (go out)?
___________________ If one marble moving very fast collides with a line of five marbles on a ruler track, what is the speed of the ejected marble(s)?
Explain why you think the marbles know what to do.
054 064
Write Newton's first law of motion.
Write Newton's second law of motion.
Write Newton's third law of motion.
Temperatures in Celsius:
_________℃ What is the temperature of a mix of melting ice and water?
_________℃ What is the temperature of melting solidified coconut oil?
_________℃ What is the typical daily indoor room temperature in Pohnpei?
_________℃ What is the temperature of the healthy living human body?
_________℃ What is the temperature of a boiling water?
Explain the difference between heat and temperature.
Explain the following types of heat movement:
Conduction:
Convection:
Radiation:
Mathematical models
_____
Identify by the letter which of the mathematical relationships on the graph represents the time versus distance relationship for a RipStik moving at a constant linear velocity with no acceleration (as in the homework 021 in the second week).
_____
Identify by the letter which of the mathematical relationships on the graph represents the time versus distance relationship for a ball falling under the constant acceleration of gravity g (as in laboratory three).
_____
Identify by the letter which of the mathematical relationships on the graph represents the height versus velocity relationship for a marble rolling from a height h down a banana leaf and onto a flat table (homework 041).
_____
Identify by the letter which of the mathematical relationships on the graph represents the length versus mass for a cantilever arm balance.
Write Newton's first law of motion.
Write Newton's second law of motion.
Write Newton's third law of motion.
Temperatures in Celsius:
_________℃ What is the temperature of a mix of melting ice and water?
_________℃ What is the temperature of melting solidified coconut oil?
_________℃ What is the typical daily indoor room temperature in Pohnpei?
_________℃ What is the outdoor temperature for a black object in the sun at noon in Pohnpei?
_________℃ What is the temperature of the healthy living human body?
_________℃ What is the temperature of a boiling water?
Provide definitions of the following types of heat movement:
Conduction:
Convection:
Radiation:
A physical science class gathered the following data for laboratory six: heat conduction. The x-axis is the change in temperature (ΔT = maximum − start).
_______________ Which material was the best conductor of heat?
_______________ Which material was the least conductor of heat?
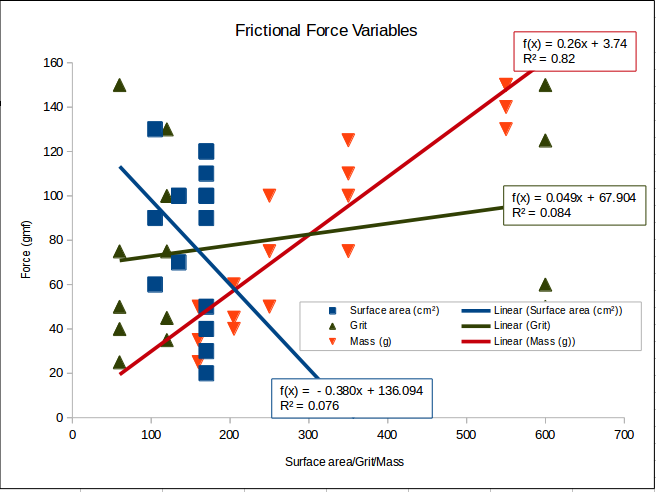
The graph shows force of friction data for surface area, grit, and mass.
Surface area: force = -0.380*SA + 136
Grit: force = 0.049*grit + 68
Mass: force = 0.26 + 3.74
_______________ According to the data gathered, which variable has the most effect?
Using the chart and analysis above, explain why you say that variable has the most effect.
_______________ According to the data gathered, which variable has the least effect?
Using the chart and analysis above, explain why you say that variable has the least effect.
Explain the difference between heat and temperature.
074 Midterm
The graph shows soap density data. Use the graphed data to answer the following questions.
__________ _____ Calculate the density ρ of Dial Basic soap.
______________ Based on the density, will Dial Basic soap floatorsink?
__________ _____ Using the density above, calculate the mass of a bar of Dial Basic soap that has a volume of 100 cm³.
__________ _____ Using the density above, calculate the volume of a bar of Dial Basic soap that has a mass of 250 grams.
__________ _____ Calculate the density ρ of Ivory soap.
______________ Based on the density, will Ivory soap floatorsink?
__________ _____ Calculate the density ρ of Neutrana soap.
______________ Critical thinking: Based on the density, will Neutrana soap floatorsink?
For the following RipStik velocity chart:
__________ _____ Determine the velocity ѵ of the RipStik.
__________ _____ If the RipStik continued at that velocity for 30 seconds, how many centimeters would the RipStik travel?
__________ _____ If the RipStik continued at that velocity for 5600 centimeters, how many seconds would the RipStik travel?
Tulpe walked 60 meters in 48 seconds.
__________ _____ Calculate Tulpe's speed in meters per second.
_______________ Is Tulpe faster or slower than 2.13 m/s speed of a RipStik?
__________ seconds. How long in seconds for Tulpe to walk 1250 meters?
The time versus distance for two runs of a RipStik were recorded in the table below.
Plot the data using circles and squares for A and B respectively.
__________ __________ Calculate the velocity for RipStik run A.
__________ __________ Calculate the velocity for RipStik B from 0 to 2 seconds.
__________ __________ Calculate the velocity for RipStik B from 2 to 4 seconds.
__________ __________ Calculate the change in velocity for RipStik B.
__________ __________ Calculate the average acceleration of RipStik B over the four seconds from 0 to 4 seconds.
__________ __________ The curve on the graph is the acceleration of RipStik. Using the point D (5 seconds, 800 cm) and the equation d = ½at², calculate the acceleration of the RipStik.
__________ _____ Using the equation d = ½gt² and an acceleration of gravity g = 980 cm/s², calculate the distance a ball will fall in one second.
__________ _____ Using the equation d = ½gt² and an acceleration of gravity g = 980 cm/s², calculate the length of time in seconds for the ball to fall 100 cm.
When a RipStik rolls down hill...
☐ The RipStik rolls at a constant rate of speed.
☐ The RipStik rolls less than twice as fast from twice as high.
☐ The RipStik rolls twice as fast from twice as high.
☐ The RipStik rolls more than twice as fast from twice as high.
My Corona EXiV car has a mass of 1150 kg. Driving at the state speed limit of 11.1 m/s, calculate the following:
__________ __________ ...the momentum p of the car.
__________ __________ ...the kinetic energy KE of the car.
A marble with a mass of 5.0 grams is 40 centimeters above a table on a banana leaf marble ramp. The marble is released and rolls down the ramp onto the table. Use an acceleration of gravity g equal to 980 cm/s² for this question.
__________ __________ Calculate the Gravitational Potential Energy of the marble before the marble is released.
__________ __________ Determine the Kinetic Energy that the marble should have at the bottom of the ramp.
__________ __________ Calculate the velocity that the marble should have at the bottom of the ramp.
__________ In the laboratory using an actual marble and banana leaf, will the marble have the speed you just calculated?
__________ Will the actual marble be fasterORslower?
Why?
Write Newton's first law of motion.
Write Newton's second law of motion.
Write Newton's third law of motion.
Temperatures in Celsius:
_________℃ What is the temperature of a mix of melting ice and water?
_________℃ What is the temperature of melting solidified coconut oil?
_________℃ What is the typical daily indoor room temperature in Pohnpei?
_________℃ What is the outdoor temperature for a black object in the sun at noon in Pohnpei?
_________℃ What is the temperature of the healthy living human body?
_________℃ What is the temperature of a boiling water?
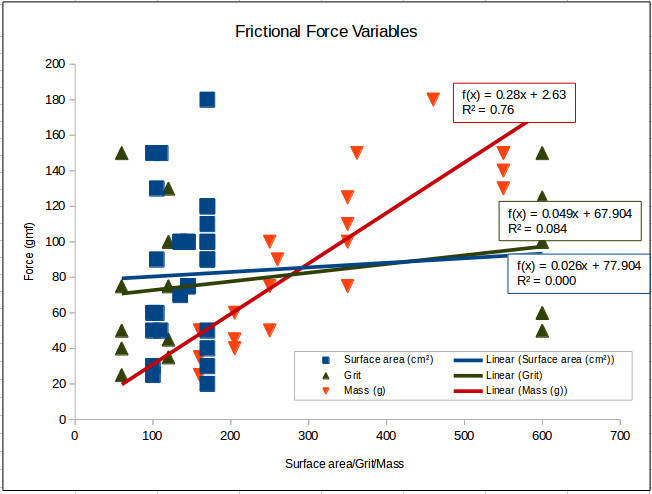
The graph shows force of friction data for surface area, grit, and mass. This graph now includes additional data from Simon, Rennie, and DeBrum
Surface area SA (◼): force = 0.026*SA + 77.904
Grit (▲): force = 0.049*grit + 67.904
Mass (▼): force = 0.28*mass + 2.63
_______________ According to the new data gathered, which variable has the most effect?
_______________ According to the data gathered, which variable has the least effect?
Define latitude:
Define longitude:
______________
When walking straight North, which number would change on the GPS unit,
the N 06° 54.594'or the E 158° 09.339' number?
_________ _____ The classroom is at E 158° 09.651'. I hid at E 158° 09.427'. Calculate the difference in arcminutes between the classroom and where I was hiding.
The classroom is at E 158° 09.651'. I hid at E 158° 09.427'. Use a value of 1842 meters per arcminute to calculate the distance in meters from the classroom to where I was hiding.
The following data is from laboratory seven.
___________ ____________ Determine the slope of the line.
___________ ____________ Use the slope to calculate the number of meters for 10 arcminutes.
___________ ____________ Use the slope to calculate the number of meters for 0.001 arcminutes.
___________ ____________ Use the slope to calculate the number of arcminutes for 5000 meters.
Write out the full names of the seven colors of the Newtonian rainbow IN ORDER:
What is the scientific name for the spread of colors that was seen in the box with the CD?
List the three primary colors of light:
List the three secondary colors of light:
List the three primary colors of pigments, paints, dyes, food color, and crayons:
List the three secondary colors of pigments, paints, dyes, food color, and crayons:
Hue Saturation Luminosity (HSL) colors:
Define Hue:
Define Saturation:
Define Luminosity:
What is the technical name of the computer color system that uses color words such as red, crimson, cyan, antiquewhite, saddlebrown?
What color of light does an orange ball reflect?
What color of light does an orange ball absorb?
What is the name of the computer color system that uses color words such as red, crimson, cyan, antiquewhite, saddlebrown?
As noted in class, indigo was added to the rainbow by Newton to generate a seven color rainbow. Looking at a spectrum, however, there really is no visually different color at the position of indigo. If indigo were to be replaced, what color would you add to the rainbow colors, the spectrum, and why?
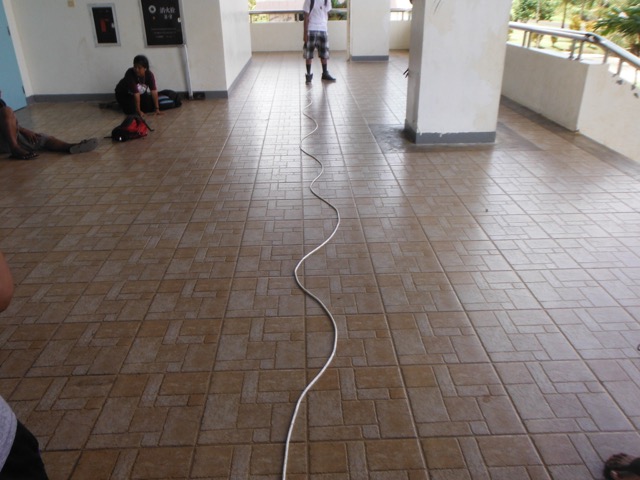
A wave was generated on a rope as seen in the diagram. There were 23 cycles in 5 seconds.
_________ How many waves are there from the first crest to the fourth crest - the 680 centimeters seen above?
λ = _________ _________ What is the wavelength λ of ONE wave?
a = _________ _________ What is the amplitude a?
τ = _________ _________ What is the period τ of ONE wave?
f = _________ _________ What is the frequency f?
ѵwave = _________ _________ What is the wave velocity ѵwave?
114
Define reflection.
Define refraction.
Define total internal reflection.
_____ A laser is beamed into a semi-circular dish of water. Will the light come out at A or B?
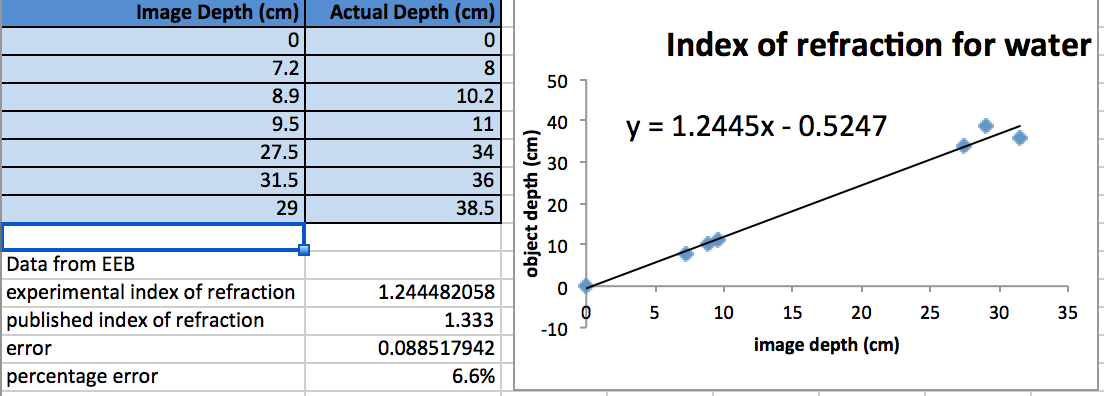
______________ Based on the data below, what is the index of refraction for water?
In Einstein's equation E = mc2, what do that letters stand for?
E:
m:
c:
Sir Stephen Hawking applied Einstein's equations of general relativity and the equations of quantum mechanics to a particular type of object found in outer space. What was the name of the type of object Stephen Hawking was working on?
A student gathered the data seen in the table below.
______________ Calculate the slope of the line. The slope is the experimental index of refraction for water.
______________ __________ Use the slope above to predict the object depth for a penny that appears to be 30 cm underwater.
______________ __________ Use the slope above to predict the image depth for a coral head that is 200 cm underwater.
______________ Water has a published index of refraction of 1.33. What is the error for the slope?
______________ Water has a published index of refraction of 1.33. What is the percentage error for the slope?
124 134
The Corning digital hot plate uses 8.7 amperes at 1043 Watts of power.
__________ _____ Calculate the voltage for the hot plate.
__________ _____ Calculate the resistance R for the hot plate.
A Whirlpool dryer uses 26 amps of current at 240 volts.
__________ _____ Calculate the resistance R for the dryer.
__________ _____ Calculate the power P for the dryer.
A Haier household refrigerator uses 1.2 amps of current at 115 volts.
__________ _____ Calculate the resistance R for the refrigerator.
__________ _____ Calculate the power P for the refrigerator.
Plot the data below on the graph provided. Draw a best fit trend line through the data.
____________ ________ For the data above, what is the resistance?
__________ What is the atomic number of Zn?
__________ What is the atomic mass of Zn?
__________ How many protons does Zn have?
__________ How many neutrons does Zn have?
__________ How many electrons does Zn have?
____________________ Zn was an element tested in the electrical conductivity, what is the full name for Zn?
Remember that the number of neutrons equals or exceeds the number of protons. The number of protons cannot exceed the number of neutrons in a stable element. Thus the more numerous nucleons are the neutrons.
_______________ Looking only at the atomic diagram, determine the atomic number of the atom depicted.
_______________ Looking at the diagram, what is the atomic mass for the atom?
_______________ Looking at the diagram and the chart on the wall, what is the one or two letter chemical abbreviation for this element?
_______________ Looking at the diagram and the chart on the wall, what is the full name for this element?
_______________ What is the common name for compound with the formula H2O?
_______________ In general, what color do acids tend to turn floral pigment fluids?
_______________ In general, what color do bases tend to turn floral pigment fluids?
_______________ Are lime fruits acid, base, or neutral?
_______________ Is vinegar an acid, base, or neutral?
_______________ Is cream of tartar an acid, base, or neutral?
_______________ Is water an acid, base, or neutral?
_______________ Is baking soda an acid, base, or neutral?
_______________ Is ammonia an acid, base, or neutral?
_______________ Is a bar of hand soap an acid, base, or neutral?
_______________ Is laundry detergent an acid, base, or neutral?
_______________ Is bleach an acid, base, or neutral?
154
Words
antimatter     bananas         big bang        big rip
black holes    electromagnetic galaxies        gravitational
mass           protons         quarks          rotation
strong nuclear                 weak nuclear
Atoms are made up of electrons, neutrons, and ______________.
Electrons are very very small. Electrons are so small that they effectively have no inside. Protons and neutrons are larger. Protons and neutrons are made up of ____________.
The positron is the opposite of the electron. The positron has the same size and mass as the electron, but the opposite charge. The positron is made of matter which also the opposite of the matter from which an electron is made. When a positron and electron collide, they annihilate each other. The positron is an example of ______________________.
There are only four forces. The four forces are:
__________________________
______________________________
____________ ______________
________ ______________
The Higgs boson would provide an explanation of why matter has ________.
Vera Rubin studied the rotation speed of ________________.
In Vera Rubin's study did stars farther from the center orbit more slowly as predicted by Newton's laws? ____
When Carlos Frenk ran computer simulations of the universe, galaxies failed to form until dark matter was:
removed
one fifth the amount of visible matter
equal to the amount of visible matter
five times the amount of visible matter
Does dark matter interact with itself? _____
Saul Perlmutter was studying the rate of expansion of the universe. Perlmutter found that the universe is...
... expanding at a rate that is decreasing over time
... expanding at a constant rate over time
... expanding at a rate that is increasing over time
Phantom energy is a hypothetical form of dark energy that is even more potent than the cosmological constant at increasing the expansion of the universe. The remarkable feature is that phantom energy possesses a negative kinetic energy. If it exists, it could cause the expansion of the universe to accelerate so quickly that a scenario known as the ______ ______ would occur.
Does a site swap throw of 3 land in the same hand or the other hand?
Use arrows to trace the path for the "balls" below for the site swap equation 3 and 51
3:  •   ◦   ❖
   ___ ___ ___ ___ ___ ___ ___ ___ ___ ___ ___ ___
    R   L   R   L   R   L   R   L   R   L   R   L


51: •       ◦      ❖
   ___ ___ ___ ___ ___ ___ ___ ___ ___ ___ ___ ___
    R   L   R   L   R   L   R   L   R   L   R   L
error = experimental value − expected value
mass m = density ρ × Volume V
distance d = velocity ѵ × time t ѵ = at ѵ = gt d = ½at² d = ½gt² where g is the acceleration of gravity g = 980 cm/s²
Gravitational Potential Energy GPE = mgh
Kinetic Energy KE = ½mѵ²
momentum = mass m × velocity ѵ
Force F = mass m × acceleration a
Gravitational Potential Energy GPE = mgh
where the acceleration of gravity g = 980 cm/s²
Kinetic Energy KE = ½mѵ²
momentum p = mass m × velocity ѵ
period τ = 1 ÷ (frequency f )
velocity ѵ = wavelength λ * frequency f
Voltage V = current i * resistance R
Power P = iV