psg1 094 ∿ Name:
☁ ________________________
☁ ________________________
- A wave was generated on a rope as seen in the diagram. There were 23 cycles in 5 seconds.
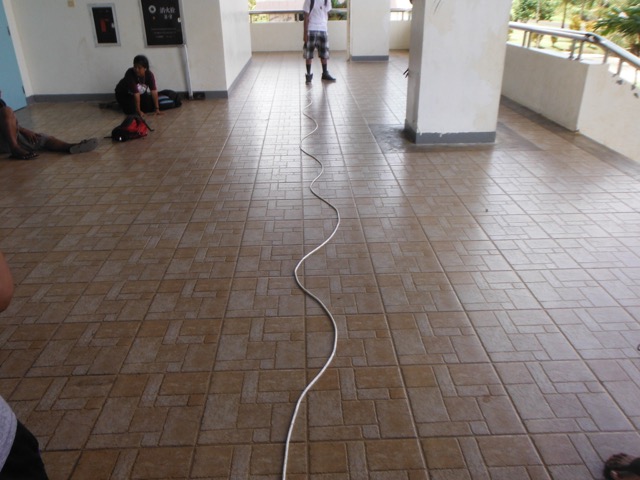
- _________ How many waves are there from the first crest to the fourth crest - the 680 centimeters seen above?
- λ = _________ _________ What is the wavelength λ of ONE wave?
- a = _________ _________ What is the amplitude a?
- τ = _________ _________ What is the period τ of ONE wave?
- f = _________ _________ What is the frequency f?
- ѵwave = _________ _________ What is the wave velocity ѵwave?
- List the three processes that produce precipitation:
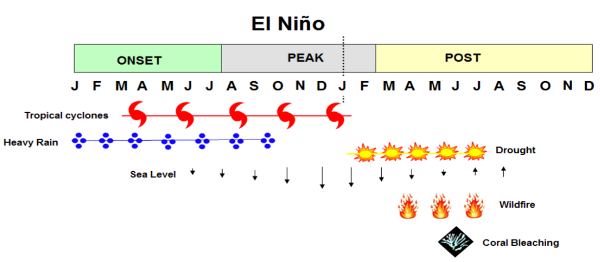
- Use the following chart to help explain the hazards associated with El Niño and when during an El Niño cycle those hazards occur for Micronesia.
- Explain the meaning and the significance of Sea Surface Temperatures with respect to El Niño.
- Explain the meaning and the significance of Southern Oscillation index with respect to El Niño.
- A student gathered the data seen in the table below.
- Plot the data on the graph.
- __________ __________ Calculate the experimental speed of sound based on the data. Include the units with your answer.
- __________The published value was 349 m/s. Calculate the percentage error for this data.
- __________ __________ Based on the experimental data, how long for a sound to travel 615.6 meters?
period τ = 1 ÷ (frequency f )
velocity ѵ = wavelength λ * frequency f