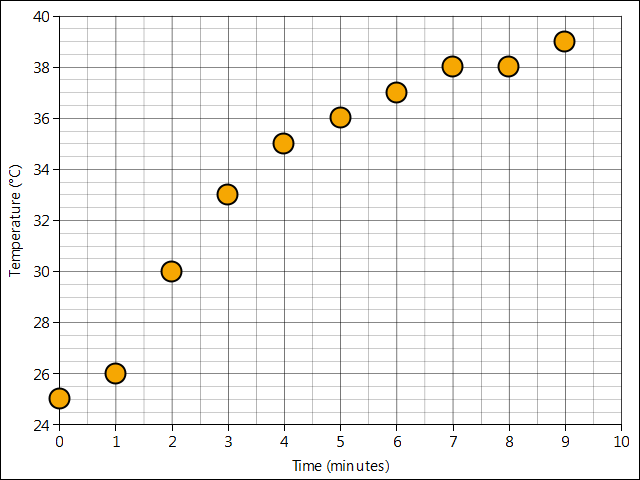
The first graph shows data gathered by a student in SC 130 physical science.
__________ _____ Calculate the density ρ of the soap (include units!).
______________ Will the soap floatorsink?
______________ Based on the density, what brand of soap is the above bar?
______________ A bath size bar of the soap has a mass of 132 grams. Use the density calculated to determine the volume of a 132 gram bar of the soap.
A bar of Lux Magical Spell soap has a length of 7.5 cm, a width of 5.1 cm, a height of 2.0 cm and a mass of 85.0 grams.
__________ _____ What is the volume of the soap?
__________ _____ What is the density of the soap?
__________ _____ What will be the slope of the volume versus mass line on an xy scattergraph of volume versus mass for the Lux soap?
A rolling ball cannot generate a vertical line on a time versus distance graph. Why?
____________________
A marble is rolled from a height h of 22 cm on a banana leaf marble ramp. Use the theoretic equation
to calculate the velocity of the marble at the bottom of the ramp.
During a RipStik ride in the classroom I held a ball in the palm of my outstretched hand. I was moving at a constant speed and then I suddenly stopped. The ball kept going. Using Newton's laws explain in plain English why the ball kept going.
Graph one is time versus distance for a RipStik castor board going up a gentle hill and then back down the hill. Graph two is time versus distance for moving RipStik castor boards.
On Monday I rode a RipStik up a gentle slope, turned around, and came back down the slope. the time versus distance data for this is shown in graph one.
___________________ What is the name of the shape formed by the curve on graph one?
___________________ Between zero and seven seconds, what is happening to my velocity on graph one?
___________________ At exactly seven seconds, what is my velocity according to graph one?
___________________ Between seven and fourteen seconds, what is happening to my velocity on graph one?
___________________Toughie: During the fourteen second run is the direction of the acceleration changing?
For the RipStik data graph two:
_____ Which letter labels the RipStik moving faster at a constant rate of acceleration.
_____ Which letter labels the RipStik moving with a non-constant deceleration .
_____ Which letter labels the RipStik moving at a constant speed with, no acceleration.
_______ ___________ Determine the speed of RipStik run C.
_______ ___________ Determine the speed of RipStik run B from 0 to 1 second.
_______ ___________ Determine the speed of RipStik run B from 2 to 5 seconds.
_______ ___________ Given that for run A distance = ½*acceleration*time²
and the coordinate (3 s, 900 cm)
shown on the graph, calculate the value of the acceleration.
Short form of equation: d=½at²
_____________ Which of Newton's laws says that once moving, an RipStik continues to move at a constant velocity without any further swizzling (wiggling)?
_____________ Which of Newton's law governs the accelerating motion of a swizzled (wiggled) RipStik?
Use the data in table two to answer the following questions on pulleys.
Table one
force (gmf)
load (gmf)
20
50
80
200
140
350
180
450
____________ Based on the table one data, what is the actual mechanical advantage for the pulley system?
____________ The pulley system in table one had three load lines. What is the ideal mechanical advantage?
____________ Use the preceding two questions to calculate the efficiency of the pulley system.
__________ A block and tackle on a crane used to lift solar panels had four load lines. What is the Ideal Mechanical Advantage for the crane based on the crane having four load lines?
__________ _____ If the crane with the four load line block and tackle lifts a steel beam with a mass of 800 kg, how much force will the lift motor have to produce? Use the Ideal Mechanical Advantage to make your calculation.
Temperatures in Celsius
_________°C What is the temperature of a mix of melting ice and water?
_________°C What is the temperature of melting solid coconut oil?
_________°C What is the typical daily room temperature in Pohnpei?
_________°C What is the temperature of the healthy living human body?
_________°C What is the temperature of a boiling water?
______________
When walking straight East, which number would change on the GPS unit,
the N 06° 54.566'or the E 158° 09.597' number?
_________ _____ The classroom is at E 158° 09.651'. Dana was at E 158° 09.314'. Use a value of 1820 meters per minute to calculate the distance from the classroom to Dana.
____________________ Plot the data in table two on the next page on the graph next to the table. Calculate the slope of the line.
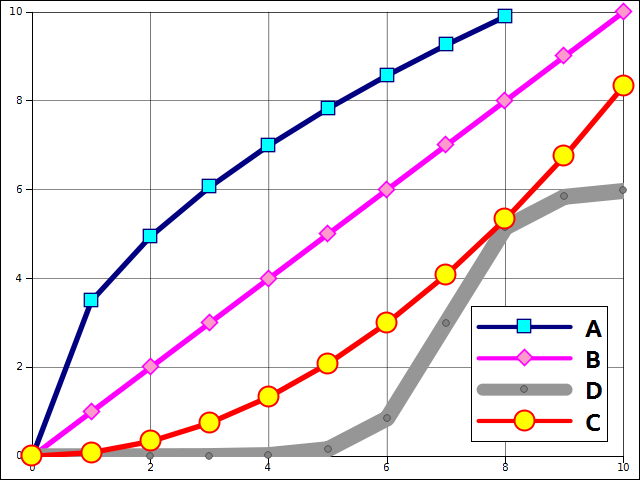
The xy scattergraph plots four mathematical models for systems in physical science. Match the graph plot to the model. Write the letter for the matching model in the blanks below.
_____ linear
_____ logistic
_____ quadratic parabola
_____ square root
Sketch a best fit linear trendline through the data in the chart below. Calculate the slope and y-intercept for the data.
slope: __________________
intercept: __________________
Volume V = length l × width w × height h
mass m = density ρ × Volume V
V = lwh d = ѵt
ѵ = at d = ½at² d = ½gt²
where g is the acceleration of gravity. g = 980 cm/s² (cgs) g = 9.8 m/s² (mks) GPE = mgh
where GPE is gravitational potential energy
m is mass
g is the acceleration of gravity
h is the height KE = ½mѵ²
where KE is kinetic energy
momentum p = mѵ
AMA Actual Mechanical Advantage
IMA Ideal Mechanical Advantage
Mechanical efficiency: AMA ÷ IMA

 The xy scattergraph plots four mathematical models for systems in physical science. Match the graph plot to the model. Write the letter for the matching model in the blanks below.