______________ If Marchleen walks east from the gym towards the bookstore, which number changes on her GPS: the north latitudeORthe east longitude number?
_________ _________
Aprileen walked from E 158° 09.657' to E 158° 09.474'. How far did Aprileen walk in minutes?
_________ _________
While walking from E 158° 09.657' to E 158° 09.474' Mayleen measured a distance of 358 meters. Calculate the number of meters per minute.
______________ Is Micronesia presently experiencing an El Niño or a La Niña?
______________ In which condition are Pohnpei and Kosrae most likely to experience tropical storms and typhoons: El Niño or a La Niña?
______________ In which condition are Pohnpei and Kosrae most likely to experience droughts (no rain) in the months of January, February, and March: El Niño or a La Niña?
A RipStik was swizzled ("wiggled") across a poster pad paper. The sinusoidal swizzle wave can be seen in the diagram below.
λ = _________ _________ Determine the wavelength λ of one wave of the RipStik swizzle wave.
a = _________ _________ Determine the amplitude a of the RipStik swizzle wave.
τ = _________ _________ The RipStik took a duration of 0.40 seconds to travel the 40 centimeters seen on the diagram above. Determine the period τ for the RipStik swizzle wave.
f = _________ _________ Calculate the RipStik swizzle wave frequency f.
ѵwave = _________ _________ Use the wavelength λ and frequency f to calculate the velocity ѵwave of the RipStik swizzle wave.
_________ How many wavelengths in all are there on the "paper" above?
_________ _________ For the laboratory seven data on the following graph, what is the experimental speed of sound?
_____________ Given that the actual (that predicted by theory, also known as the theoretic value) speed of sound was 350 m/s, determine the percentage error.
_____ A laser is beamed into a semi-circular dish of water. Will the light come out at A or B?
In the diagram, draw the path of a light ray from the penny to the eye.
Plot the following data on the graph provided and draw a linear best fit line through the data points on the graph.
______________ Calculate the slope of the linear best fit line. The slope is the experimental index of refraction for the material.
______________ The above material is reported to have a theoretic index of refraction of 1.33. What is the percentage error for the slope you calculated based against a theoretic value of 1.33?
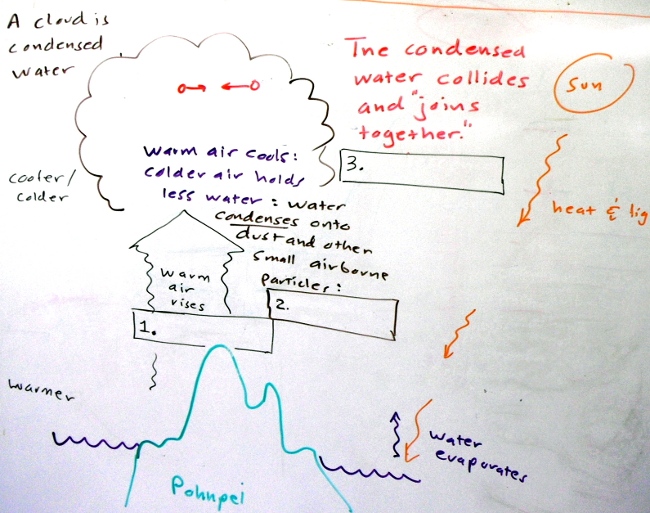
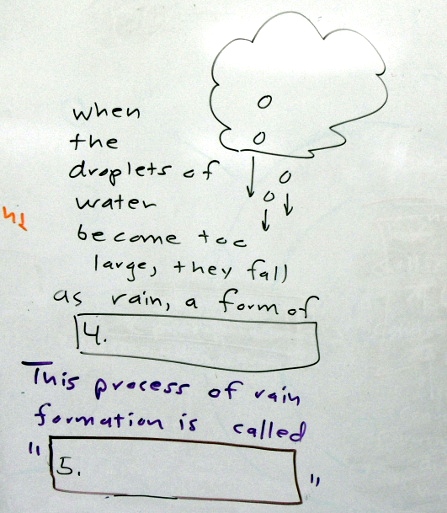
Referring to the following images, fill in the blanks with the correct letter from the terminology list:
______________
______________
______________
______________
______________
Use the space at the bottom of the page to compare and contrast nearsightedness (myopia), farsightedness (hyperopia), and presbyopia.
distance d = velocity ѵ * time t
period τ = 1 ÷ (frequency f )
velocity ѵ = wavelength λ * frequency f
Terminology list:
A. Bergeron process precipitation
B. coalescence
C. collision
D. collision-coalescence precipitation
E. condensation
F. conduction
G. convection
H. evaporation
I. orographic precipitation
J. precipitation
K. radiation