Marble roll quadratic graphing and Qalculate! computer graphing exercise

1. Place an 8½ by 11 inch paper on a slight incline.
2. Roll a marble to produce a parabolic arc on the paper. Sketch the arc, re-rolling the marble as necessary to refine the arc.
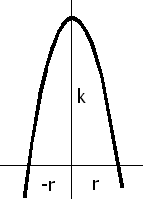
3. Use a ruler to draw an x-axis and y-axis, with the roots equidistant from the y-axis and the y-axis passing through the vertex.
4. The distance from the y-axis to either root is r.
5. The distance form the x-axis to the vertex is k.
6. The equation of this line is:

7. In the following example r was 7.5 cm and k was 18 cm. Your numbers will differ, as will your specific equation.

8. The Qalculate! calculator is on the Accessories submenu of the Application menu. Enter the equation as seen below with the appropriate parentheses.


9. Click on the button to the right of the data entry window to process the equation.


10. From the File menu, select Plot Function/Data.


11. The plot window will open automatically.


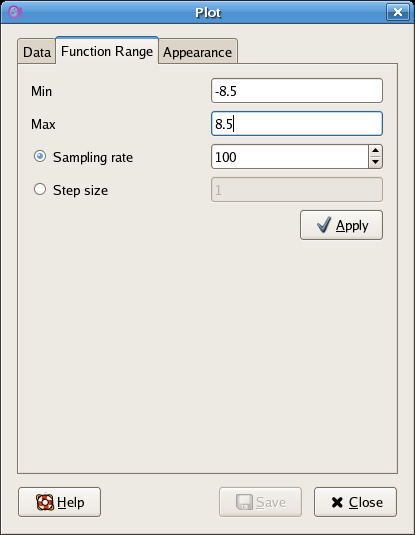
12. Click on the Function Range tab and set your min to one less than your negative root, your max to one more than your positive root.


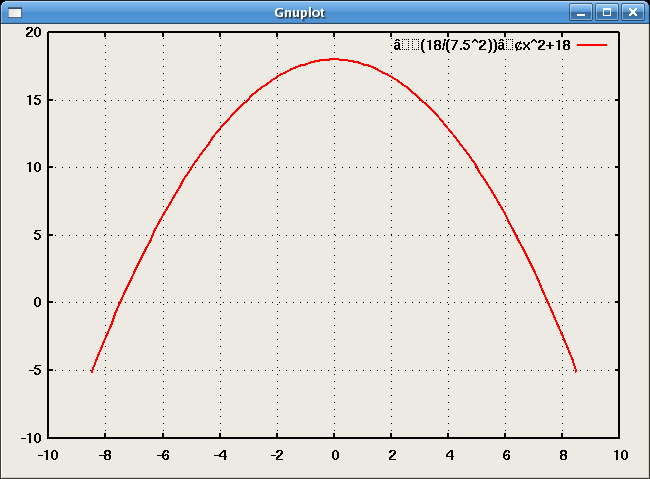
13. Return to the data tab (seen above, and click on the +Add button. The graph of you marble will appear.


Do the x-intercepts and the vertex agree with the measurements made for your marble?