Thanks to Jonathan for providing a corrected table.
I used the data he sent to generate a conversion table, his original data and
the conversion table are at the end of this email.
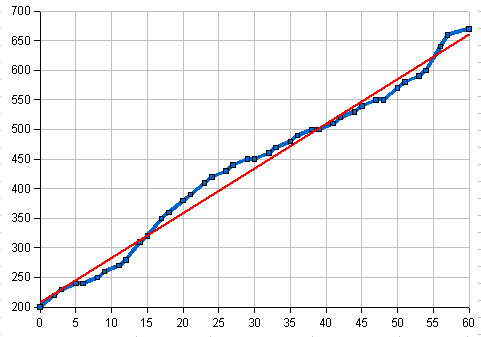
An x-y scatter graph of the conversion looks like (the
blue line, raw score on the x-axis, TOEFL on the y-axis):
Please let me know if the graphic does not come through
for you, it may be a result of the format I have used. The most obvious
feature is that the line wiggles, but it is not actually a curve. A linear
regression (the red line) can closely approximate the wiggling line.
The largest difference between the blue and red lines is
around a raw score (x-axis) of 24 to 25. The conversion table would
convert to a 410 or 420, the red line would convert to a 390 or 400. Thus
the TOEFL conversion table would push a few more marginal students into IEP
around the 400 cut-off point.
Around the other critical value of a raw score of 36 (the
60% point) the conversion tables and the linear regression agree.
The following table presents the coefficients for the red
line and the differences from the faulty conversion function, as well as the
impact on the cut-off points.
|
Corrected |
|
Original val |
Cuts used |
| slope |
7.5429 |
|
9.15 |
|
| intercept |
210.05 |
|
219.2 |
|
| correlation |
0.9929 |
|
0.99 |
|
| coef determination |
0.9858 |
|
|
|
| 36 |
481.59 |
Raw
36 |
548.6 |
|
| 19.2 |
354.87 |
Raw 32% of
60 |
394.88 |
|
| 500 |
38.44 |
TOEFL
500 |
30.69 |
|
| 470 |
34.46 |
TOEFL
470 |
27.41 |
27 |
| 400 |
25.18 |
TOEFL
400 |
19.76 |
20 |
The slope, intercept, correlation coefficient r, and
coefficient of determination for both the corrected and original faulty
conversion values are presented in rows two to five.
Row six uses the two functions to convert a 36 on the
reading section. Under the old faulty conversion a 36 was a 548.6.
Under the new conversion a 36 is a 481.59.
Row seven uses the two functions to convert a 19.2
on the reading section. Under the old faulty conversion
a 19.2 was a 394.88. Under the new conversion a 19.2 is a
354.87. Bear in mind that a 19.2 is 32% of 60, the cut-off percentage
reported by Paul. Both Paul and Penny (at an IEP conference years ago)
have noted that this cut between certificate and IEP is too low for a
single year program.
Note that I used a cut-off of 20, not 19.2, because I
determined my cut-off using the inverse equation to determine what raw score
generated a TOEFL of 400, the old cut point. In row ten the old faulty
function generated a 19.76 raw score for a TOEFL of 400. The corrected
function would use an IEP cut-off of 25.18. In the actual work
further below I use whole numbers, so the cut would be at 25.
Row eight calculates the raw score that a TOEFL of 500
would convert to. Under the faulty function a 500 was a 30.69 raw, using
the corrected a 500 is 38.44 raw.
Row nine makes the same calculations for 470, the
traditional IEP to national campus cut-off value.
I then made the following inputs to my spreadsheet that
now dynamically assigns admissions:
| Natl struct |
24 |
| Natl read |
34 |
| IEP struct |
16 |
| IEP read |
25 |
Note that only the reading cut-offs were changed.
The old ones were 27 and 20, the new ones are 34 and 25. The results
were
| 1 |
593 |
State |
| 2 |
299 |
IEP |
| 3 |
467 |
National |
Note that new cuts only add 74 to the IEP program system
wide.
The number of students who have to sent new
admissions letters is 355 or 26% of the students.
While I haven't the time or energy to study the impact in
each state - and some states are tougher because my data is by high school and
not by state, so one has to tally high school by high school - I can look at
Kosrae. If people are tired of me talking about Kosrae, then change the
housing policy (but that is a different long story).
Of the 89 originally admitted to the national campus, 21
get reassigned to the IEP program and 4 get reassigned to certificate level
programs. 64 would still be admitted to the national campus: still a
significant jump from the 30 some numbers of the past. KHS did a better
job preparing students this past year. Someone go congratulate
them.
Of the 27 IEP students, 16 get sent down to the
certificate level. The result is an IEP of 32 students. A gain of only
five, albeit the 32 students are a different group than the 27. The
overlap is only 11 students (11 originally and still assigned to IEP).
I know Richard Womack has used the terminology that we
have to bite the bullet on this one and fix it.
At the same time I remain concerned that this is much
less of a slam dunk than it appears to some. I remember standing around
the Saturday afternoon when we had agreed PICS had to retake the essay. I
cautioned then that this was no small thing and might not happen. My
academic colleagues said, "It has to happen." It didn't.
Once again I suspect that this beast is much more
complicated than it looks. If it helps I can resign my post as chair and
return to only teaching classes. While this would be good for me
emotionally and mentally, I doubt it would help resolve the current
crisis.
The new complication may require either a ruling from the
board or the lawyers: we have sent out an admissions letter packet including an
acceptance letter. If a student has accepted our offer, has not a contract
been formed? Are we not legally liable if we now renege on that
offer? Just wondering.
===
Warning: Heavier math stuff below
===
Finally, the reason my calculations involving 60% of 700
did not work is because 0 is not zero, it is 200. And the 700 should be
680. The test has a range of 480 (680 - 200) and hence a 60% is 0.6*480 +
200 or 488.
What happened to the 500 is 60%? 500 is 50% if and
only if the total possible is 700 and not 680: 0.6*500 + 200 = 500.
So if 680 is the top, as Jonathan asserts, then 500 is
NOT 60%. 488 is.
That is the correct algebraic formula. This means
there is a theoretical formula that has a slope of 480/60 or TOEFL = 8*raw +
200. That is, however, not the best fit linear regression. The
best fit ups the intercept and drops the slope, TOEFL = 7.5429* raw +
210.05. Note that this is due in part to the fact that the TOEFL
conversion table can never actually generate anything above a 670.
What would happen to the theoretical formula if the
maximum possible was 700? Then TOEFL = 8.3333*raw + 200.
Of course the tables show that the conversion is not
perfectly a simple linear regression. There is an odd wiggle in the line.
But with a Pearson correlation coefficient of 0.9929 where a one is perfectly
linear and zero is random, the linear regression is effectively equivalent to
the tables. The maximum residuals seen around TOEFL 400 are on the order
of ten to twenty points, a rather meaningless difference given that I am told a
TOEFL score around 400 is unreliable by 30 to 50 points (a repeat can move 30 to
50 points).
Why not use the original tables? I am too lazy to
look up 1,359 raw scores and convert them to a TOEFL. Besides, all you get
is a range to a range. This conversion work was never done by me - I do
not know if the converters converted to the top or bottom of the range.
The linear regression end runs the issue by getting the best predicted
score.
All in good faith,
Dana
----- Original Message -----
From: "Jonathan Gourlay"
Sent: Saturday, May 10, 2003 2:18 PM
Subject: Re: meeting
The high score on TOEFL is 680 and the low score is
200.
Here's the conversions. They are listed as "score ranges" because of
variations from TOEFL to TOEFL. In the past, Bastora has either taken
the top score or, maybe, figured which end of the range the score was
closer to and rounded up or down. I wasn't a part of those
calculations.
Raw
Scores
Range of Scaled
Scores
57-60
66-67
54-56
60-64
51-53
58-59
48-50
55-57
45-47
54-55
42-44
52-53
39-41
50-51
36-38
49-50
33-35
47-48
30-32
45-46
27-29
44-45
24-26
42-43
21-23
39-41
18-20
36-38
15-17
32-35
12-14
28-31
9-11
26-27
6-8
24-25
3-5
23-24
0-2
20-22
Add a zero to the scaled score and you have the sort of number that
we
are used to. Reading comprehension has traditionally been the most
difficult -- whether because it came at the end of the test or because
it's just difficult, I don't know.
-Jonathan
~~~
Jonathan's data sequenced:
| Raw |
Converted |
TOEFL |
| 0 |
20 |
200 |
| 2 |
22 |
220 |
| 3 |
23 |
230 |
| 5 |
24 |
240 |
| 6 |
24 |
240 |
| 8 |
25 |
250 |
| 9 |
26 |
260 |
| 11 |
27 |
270 |
| 12 |
28 |
280 |
| 14 |
31 |
310 |
| 15 |
32 |
320 |
| 17 |
35 |
350 |
| 18 |
36 |
360 |
| 20 |
38 |
380 |
| 21 |
39 |
390 |
| 23 |
41 |
410 |
| 24 |
42 |
420 |
| 26 |
43 |
430 |
| 27 |
44 |
440 |
| 29 |
45 |
450 |
| 30 |
45 |
450 |
| 32 |
46 |
460 |
| 33 |
47 |
470 |
| 35 |
48 |
480 |
| 36 |
49 |
490 |
| 38 |
50 |
500 |
| 39 |
50 |
500 |
| 41 |
51 |
510 |
| 42 |
52 |
520 |
| 44 |
53 |
530 |
| 45 |
54 |
540 |
| 47 |
55 |
550 |
| 48 |
55 |
550 |
| 50 |
57 |
570 |
| 51 |
58 |
580 |
| 53 |
59 |
590 |
| 54 |
60 |
600 |
| 56 |
64 |
640 |
| 57 |
66 |
660 |
| 60 |
67 |
670 |