Confidence intervals • Distributions • Raw data
All data in the following report derives from grades data from the Better Entrance and Tracking TechnologY database (BETTYbase) in the Office of Admissions and Records for Spring 2002 and Fall 2002 terms. Summer 2002 is not included.
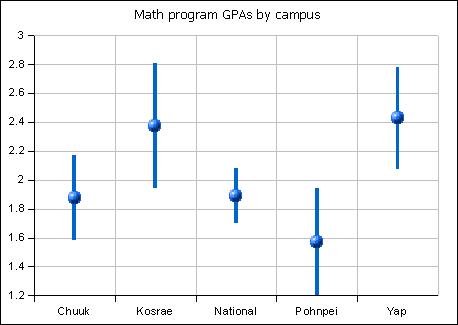
The following data summarizes the grade point average by campus for math courses, both MS 09x and MS 1xx level courses.
| Low | High | Mean | Count | Pooled stdev | tc | Error E | ||
|---|---|---|---|---|---|---|---|---|
| Chuuk | 1.58 | 2.17 | 1.88 | 237 | 0.15 | 1.97 | 0.30 | |
| Kosrae | 1.94 | 2.81 | 2.38 | 112 | 0.22 | 1.98 | 0.43 | |
| National | 1.70 | 2.08 | 1.89 | 825 | 0.10 | 1.96 | 0.19 | |
| Pohnpei | 1.20 | 1.95 | 1.57 | 192 | 0.19 | 1.97 | 0.37 | |
| Yap | 2.08 | 2.78 | 2.43 | 112 | 0.18 | 1.98 | 0.35 |
The campuses fall into roughly two tiers. The upper tier consists of the Kosrae and Yap campuses. The lower tier consists of the Chuuk, National, and Pohnpei campus. In each tier the grade point averages are not statistically distinguishable from each other.
The chart depicts the mean at the center of each vertical bar. The vertical extent of the bar reflects the 95% confidence interval for the mean.
The only campus to move significantly was the movement of Chuuk from the upper tier to the lower tier. In the realm of mathematics in the College of Micronesia-FSM system the lower tier is the expected location if the courses are being run at the appropriate level of difficulty. While a higher average grade point average is theoretically desireable, inter-campus transfers have historically suggested that higher grade point averages are not obtained when material is taught on level and the students face the full array of student learning outcomes in each of the outlines for the courses.
The following data summarizes the grade point average by campus for science courses excluding those designated premedical science. The data also includes the marine science and premedical science courses, which are currently offered only at the national campus. Marine science courses are those with an MR prefix. The premedical sciences are SC 122a Anatomy and Physiology I, SC 122b A & P II, and SC 180 Microbiology. These three courses are the only courses that are specific to the Health Careers Opportunities Program (HCOP). The HCOP program is at present our only path for students preparing to go on in the allied health fields including medicine.
| Low | High | Mean | Count | Stdev | tc | Error E | |
|---|---|---|---|---|---|---|---|
| Chuuk | 2.02 | 2.25 | 2.13 | 323 | 1.08 | 1.97 | 0.12 |
| Kosrae | 2.76 | 3.14 | 2.95 | 78 | 0.85 | 1.99 | 0.19 |
| National | 1.61 | 1.83 | 1.72 | 562 | 1.37 | 1.96 | 0.11 |
| Pohnpei | 1.34 | 1.93 | 1.64 | 72 | 1.26 | 1.99 | 0.30 |
| Yap | 2.55 | 2.97 | 2.76 | 71 | 0.90 | 1.99 | 0.21 |
| Marine | 1.62 | 2.25 | 1.93 | 58 | 1.20 | 2.00 | 0.31 |
| PreMed | 2.20 | 2.85 | 2.52 | 42 | 1.04 | 2.02 | 0.32 |
The confidence intervals fall into roughly three tiers. The upper tier consists of the Kosrae and Yap campuses along with the premedical sciences. The Chuuk campus is alone in a middle tier. The lower tier consists of the National, and Pohnpei campuses along with the marine science program. In each tier the grade point averages are not statistically distinguishable from each other.
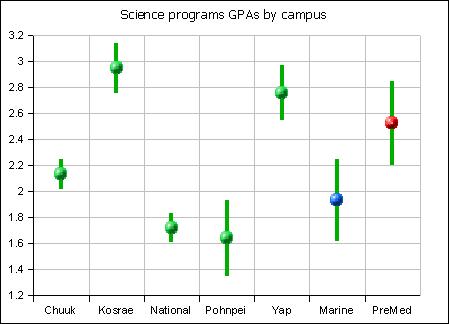
The chart depicts the mean at the center of each vertical bar. The vertical extent of the bar reflects the 95% confidence interval for the mean.
Trends in the science course grade point averages over time have not been been tracked. There is also virtually no inter-campus transfer data by which to guage the relative level of a given science program. The bulk of science courses are single shot terminal courses.
The exception to this are the premedical science courses. These courses have prerequisite course requirements, typically SC 120 Biology or, optionally, MR 120 Marine Biology. This may explain in part the higher grade point average for these courses: courses such as SC 120 Biology act as gateway courses. Academically weaker students are screened out by the prerequisite courses.
The following data is the number of each grade given in each campus for math courses. The left section of the table is the count of the number of grades. The middle section is the percentage for each grade of all grades awarded at that campus. The right section gives the percentage of students who were promotable (A, B, or C) and those who were not (D, F, or W).
| Campus | A | B | C | D | F | W | Sum | A | B | C | D | F | W | Promote | Repeat |
|---|---|---|---|---|---|---|---|---|---|---|---|---|---|---|---|
| Chuuk | 18 | 42 | 90 | 67 | 15 | 232 | 0.08 | 0.18 | 0.39 | 0.29 | 0.06 | 0.65 | 0.35 | ||
| Kosrae | 14 | 36 | 46 | 10 | 3 | 3 | 112 | 0.13 | 0.32 | 0.41 | 0.09 | 0.03 | 0.03 | 0.86 | 0.14 |
| National | 132 | 154 | 228 | 113 | 105 | 91 | 823 | 0.16 | 0.19 | 0.28 | 0.14 | 0.13 | 0.11 | 0.62 | 0.38 |
| Pohnpei | 11 | 29 | 68 | 35 | 36 | 13 | 192 | 0.06 | 0.15 | 0.35 | 0.18 | 0.19 | 0.07 | 0.56 | 0.44 |
| Yap | 16 | 36 | 45 | 10 | 1 | 2 | 110 | 0.15 | 0.33 | 0.41 | 0.09 | 0.01 | 0.02 | 0.88 | 0.12 |
The following chart depicts the percentage for each grade of all grades awarded at that campus. The curves are cubic spline curves.
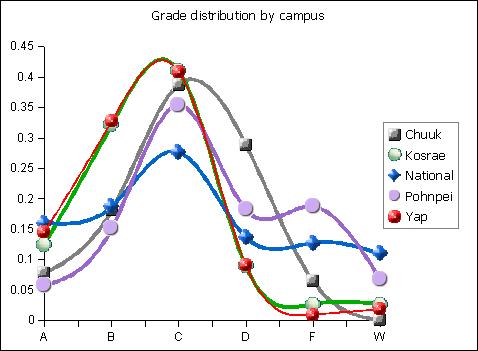
The distribution of math grades is complex. For smaller campuses the curves may depict the grade distribution for one or two instructors. The national campus distribution, the flattest of the distributions, reflects the combined grading by six instructors across a broad range of math courses.
The campuses in the upper tier in the math confidence interval diagram appear to differ primarily in the number of B's awarded to students. These two campuses also have almost insignificant rates of F's and W's.
Pohnpei and the national campus are unique in their relatively high rates of F and W grades. The high rate of F and W grades, both worth 0 grade points in the database, offset the national campus' high rate of A's. The national campus actually leads in percentage of A's achieved by students.
The promotion versus repeat rates for the campuses is depicted in the diagram below.
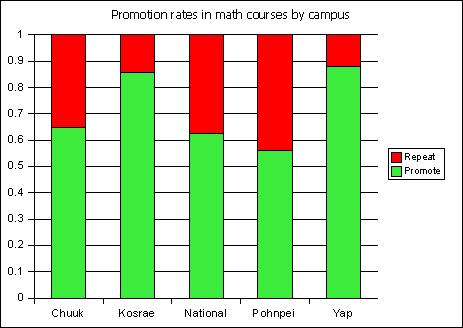
Again the college math system exhibits a two tier or bimodal distribution. Kosrae and Yap have statistically indistinguishable high rates of promotion. Chuuk, Pohnpei, and the national campus promote far fewer students course to course.
The differentials in promotion rate suggest that the external validation by testing a sample of students will eventually have to done across all campuses.
The following data is the number of each grade given in each campus for science courses. The left section of the table is the count of the number of grades. The middle section is the percentage for each grade of all grades awarded at that campus. The right section gives the percentage of students who passed (A, B, C, or D) and those did not (F, or W).
| Subject | Campus | A | B | C | D | F | W | Sum | A | B | C | D | F | W | Pass | FW |
|---|---|---|---|---|---|---|---|---|---|---|---|---|---|---|---|---|
| National | Marine | 7 | 12 | 15 | 18 | 4 | 2 | 58 | 0.12 | 0.21 | 0.26 | 0.31 | 0.07 | 0.03 | 0.90 | 0.10 |
| Science | Chuuk | 38 | 76 | 121 | 67 | 20 | 1 | 323 | 0.12 | 0.24 | 0.37 | 0.21 | 0.06 | 0.003 | 0.93 | 0.07 |
| Science | Kosrae | 19 | 41 | 15 | 1 | 1 | 77 | 0.25 | 0.53 | 0.19 | 0.01 | 0.01 | 0.99 | 0.01 | ||
| Science | National | 76 | 92 | 143 | 101 | 101 | 47 | 560 | 0.14 | 0.16 | 0.26 | 0.18 | 0.18 | 0.08 | 0.74 | 0.26 |
| Science | Pohnpei | 7 | 9 | 25 | 13 | 11 | 7 | 72 | 0.10 | 0.13 | 0.35 | 0.18 | 0.15 | 0.10 | 0.75 | 0.25 |
| Science | Yap | 15 | 29 | 24 | 1 | 2 | 71 | 0.21 | 0.41 | 0.34 | 0.01 | 0.03 | 0.97 | 0.03 | ||
| National | PreMed | 9 | 10 | 19 | 2 | 2 | 42 | 0.21 | 0.24 | 0.45 | 0.05 | 0.05 | 0.95 | 0.05 |
The following chart depicts the percentage for each grade of all grades awarded at that campus.
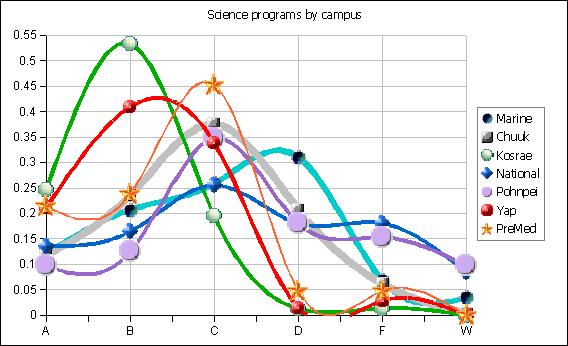
The distribution of science grades is complex. For smaller campuses the curves may depict the grade distribution for one or two instructors. The national campus distribution, the flattest of the distributions, reflects the combined grading by eight instructors across a broad range of science courses.
The campuses in the upper tier in the science confidence interval diagram, Kosrae and Yap, appear to differ primarily in the number of B's awarded to students. Both of these campuses peak at a B, while the other campuses peak at C. These two campuses also have almost insignificant rates of F's and W's.
The marine science program is also unique in having a grade peak at a D. The low number of F's and W's relative to D's suggests that grading scheme choices might be being made by the instructors in this field that assist students in completing with a below average pass rather than failing outright.
The screening effect of prerequisite courses is probably responsible for the premedical science students attaining primarily A', B's, and C's. This suggests that the prerequisites are beneficial in screening for students capable of accomplishing the material.
Pohnpei and the national campus are again unique in their relatively high rates of F and W grades.
The Kosrae campus leads in percentage of A's and B's achieved by students.
Chuuk campus appears to have the distribution closest to a bell shaped symmetric normal curve.
The pass versus fail/withdraw rates for the campuses is depicted in the diagram below.
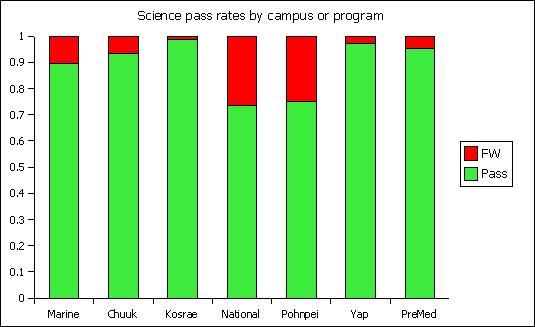
The diagram above suggests that pass rates are similar for Pohnpei and the national campus.
As a general overview pass rates are higher than promotion rates for mathematics, although these two are not the exact same measure. The impact, however, does reflect this differential. Students complete a science requirement on a D. The bulk of students in the sciences are taking a science requirement as part of their general education core requirements. These students are not in a science sequence. Even where they are taking a prerquisite course, they can continue the sequence with a grade as low as a D.
The result is that mathematics remains a stronger barrier to graduation than science, the same situation that the college identified in 1994 as it prepared a Title III grant proposal.
| Count | |||||
| Subject | Chuuk | Kosrae | National | Pohnpei | Yap |
| MR | 58 | ||||
| MS | 65 | 34 | 397 | 49 | 24 |
| MSR | 172 | 78 | 428 | 143 | 88 |
| MSS | 224 | 48 | 73 | ||
| SC | 323 | 78 | 562 | 72 | 71 |
| SCM | 42 | ||||
| Average | |||||
| Subject | Chuuk | Kosrae | National | Pohnpei | Yap |
| MR | 1.93 | ||||
| MS | 1.83 | 2.18 | 1.85 | 1.43 | 2.25 |
| MSR | 1.9 | 2.46 | 1.93 | 1.62 | 2.48 |
| MSS | 1.42 | 2.71 | 2.29 | ||
| SC | 2.13 | 2.95 | 1.72 | 1.64 | 2.76 |
| SCM | 2.52 | ||||
| StDev | |||||
| Subject | Chuuk | Kosrae | National | Pohnpei | Yap |
| MR | 1.2 | ||||
| MS | 1.02 | 1.11 | 1.42 | 1.12 | 0.68 |
| MSR | 1.05 | 0.94 | 1.35 | 1.21 | 1.06 |
| MSS | 1.19 | 1.01 | 1.2 | ||
| SC | 1.08 | 0.85 | 1.37 | 1.26 | 0.9 |
| SCM | 1.04 | ||||
| Grade distributions By State | |||||||
| Campus | Subject | A | B | C | D | F | W |
| C | MS | 2 | 17 | 20 | 20 | 5 | |
| C | MSR | 16 | 25 | 70 | 47 | 10 | |
| C | MSS | 11 | 30 | 69 | 47 | 60 | 3 |
| C | SC | 38 | 76 | 121 | 67 | 20 | 1 |
| K | MS | 5 | 6 | 16 | 4 | 1 | 2 |
| K | MSR | 9 | 30 | 30 | 6 | 2 | 1 |
| K | MSS | 11 | 18 | 15 | 2 | 1 | |
| K | SC | 19 | 41 | 15 | 1 | 1 | |
| N | MR | 7 | 12 | 15 | 18 | 4 | 2 |
| N | MS | 69 | 63 | 106 | 57 | 71 | 31 |
| N | MSR | 63 | 91 | 122 | 56 | 34 | 60 |
| N | SC | 76 | 92 | 143 | 101 | 101 | 47 |
| N | SCM | 9 | 10 | 19 | 2 | 2 | |
| P | MS | 2 | 5 | 18 | 11 | 10 | 3 |
| P | MSR | 9 | 24 | 50 | 24 | 26 | 10 |
| P | MSS | 8 | 31 | 18 | 6 | 6 | 3 |
| P | SC | 7 | 9 | 25 | 13 | 11 | 7 |
| Y | MS | 9 | 12 | 3 | |||
| Y | MSR | 16 | 27 | 33 | 7 | 1 | 2 |
| Y | SC | 15 | 29 | 24 | 1 | 2 | |
| Grade Distributions by Subject and then by state | |||||||
| Subject | Campus | A | B | C | D | F | W |
| MR | N | 7 | 12 | 15 | 18 | 4 | 2 |
| MSC | C | 2 | 17 | 20 | 20 | 5 | |
| MSC | K | 5 | 6 | 16 | 4 | 1 | 2 |
| MSC | N | 69 | 63 | 106 | 57 | 71 | 31 |
| MSC | P | 2 | 5 | 18 | 11 | 10 | 3 |
| MSC | Y | 9 | 12 | 3 | |||
| MSR | C | 16 | 25 | 70 | 47 | 10 | |
| MSR | K | 9 | 30 | 30 | 6 | 2 | 1 |
| MSR | N | 63 | 91 | 122 | 56 | 34 | 60 |
| MSR | P | 9 | 24 | 50 | 24 | 26 | 10 |
| MSR | Y | 16 | 27 | 33 | 7 | 1 | 2 |
| Math | C | 18 | 42 | 90 | 67 | 15 | 0 |
| Math | K | 14 | 36 | 46 | 10 | 3 | 3 |
| Math | N | 132 | 154 | 228 | 113 | 105 | 91 |
| Math | P | 11 | 29 | 68 | 35 | 36 | 13 |
| Math | Y | 16 | 36 | 45 | 10 | 1 | 2 |
| MSS | C | 11 | 30 | 69 | 47 | 60 | 3 |
| MSS | K | 11 | 18 | 15 | 2 | 1 | |
| MSS | P | 8 | 31 | 18 | 6 | 6 | 3 |
| SC | C | 38 | 76 | 121 | 67 | 20 | 1 |
| SC | K | 19 | 41 | 15 | 1 | 1 | |
| SC | N | 76 | 92 | 143 | 101 | 101 | 47 |
| SC | P | 7 | 9 | 25 | 13 | 11 | 7 |
| SC | Y | 15 | 29 | 24 | 1 | 2 | |
| SCM | N | 9 | 10 | 19 | 2 | 2 | |
Program Outcomes Internal External Diagram
Division Objectives & Indicators; Program Learning Outcomes
Math Program Outcomes Evaluation 21
March 2003