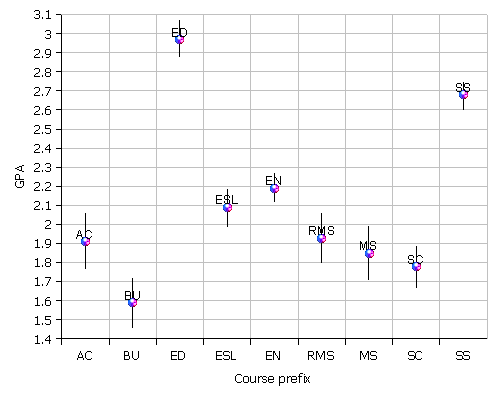
I went back and generated the sample size n and sample standard deviations sx from the database. I generated a t-critical using tinv(1-confidence level,degrees of freedom) function in OpenOffice.org with a confidence level of 0.95 (equivalent to an alpha of 0.05 in a two tail hypothesis test). I then calculated tc*sx/sqrt(n) to obtain an Error E. This was subtracted from and added to the mean to obtain a 95% confidence interval. I then graphed this data and converted the graph to a PNG graphics file which is attached. The raw data is in gpaci.xls.
The red and blue spheres on the vertical lines in gpaci.png are located at the GPA mean. The line extends up and down an amount equal to the error as calculated above. At a simplistic level, short of running an full ANOVA on the original data, anywhere the vertical bar spans vertically past a sphere on another line there is probably NOT a statistically significant separation.
Thus remedial level math and college level math are not statistically significantly separated, but ESL (ESL 088, ESL 089, ESL 098, ESL 099) is statistically separated from the remedial math mean (neither set of vertical lines overlaps the other sphere).
	Low	High	Mean
AC	1.77	2.06	1.91
BU	1.46	1.72	1.59
ED	2.88	3.07	2.97
ESL	1.99	2.19	2.09
EN	2.12	2.27	2.19
RMS	1.8	2.06	1.93
MS	1.71	1.99	1.85
SC	1.67	1.89	1.78
SS	2.6	2.75	2.68