Illustration
1: Fall 2004 - Spring 2005 data
Student Learning Outcomes Assessment
Division of Natural Sciences and Mathematics
Fall term 2006
Executive summary
Faculty in the Division of Natural Sciences and Mathematics each chose methods to measure performance on student learning outcomes in their courses during the fall of 2006. The data gathered was aggregated using a system described in the January 2006 system-wide assessment conference presentation on a proposed Student Learning Outcomes Assessment Plan.
Key findings:
Performance on course and program learning outcomes is typically below 70%
Faculty who engaged in the effort expressed gaining some insight into formative assessment information for their courses.
Coverage of program learning outcomes is not comprehensive.
Many institutional learning outcomes remain unmeasured.
The work involved proved long and difficult. The process is neither sustainable nor will the process scale-up well across the system.
When asked about the cost/benefit of the information gained versus the work done, faculty noted that the information gained served to confirm that which they already knew at the end of the course.i Thus the effort exceeded the benefit for the individual faculty member.
Report
Each faculty member was asked to determine ways to measure and report on student performance on the student learning outcomes for one of their courses. For the most part faculty chose to use item analysis of comprehensive final examinations to generate information on accomplishment of student learning outcomes. This approach, while logical and straightforward, naturally tends to limit the type of outcomes that can be measured.
The Student Learning Outcomes Assessment Plan described in the January 2006 system-wide assessment conference provided a conceptual framework by which to aggregate individual student learning outcomes.ii
For simplicity and manageability, each course outcome was mapped to a single program learning outcome and each program learning outcome was in turn mapped to a single institutional learning outcome. This "one-to-one" approach causes information loss wherein one course learning outcome might serve multiple program and institutional level learning outcomes. A "one-to-many" approach, however, would require an exponentially greater effort . In general, course learning outcomes best serve a particular program learning outcome, which in term best serve a particular institutional learning outcome. There is a limit to how many higher level outcomes a single course level outcome can conceivably serve, the "one-to-one" model is implementable and produces useful information.
The structure of this report is to move from the goal level down to the institutional learning outcomes, down to the program learning outcomes, and finally down to the course level outcomes.
Goal level
There is a story about a king who sent three wise counselors out into the world to gather all the world's information into a single book. The resulting book so pleased the king, that he sent the three wise counselors out to condense all the world's information into a single sentence. The result again pleased the king, so he asked the wise counselors to condense the world's knowledge to a single word. Decades later the now ancient counselors returned and said, "The word is 'maybe'." Aggregation ultimately reaches a point where the answer to the question of whether the number attained has any meaning is "maybe."
At the goal level, performance on goal one is given in table one.
|
Avg |
Academic goal |
|---|---|
|
15% |
Promote learning and teaching for knowledge, skills, creativity, intellect, and the abilities to seek new information and communicate effectively. |
Table 1: Learning attainment for goal one
Institutional level Student Learning Outcomes
Aggregation at this level remains problematic. Part of the difficulty is the issue of the loss of information that aggregation causes as noted above. Another complication is that the predominant choice of item analysis of comprehensive final examinations tends to emphasize the first institutional learning outcome, knowledge. Skills, communication, and critical thinking can conceivably be measured in a final assessment instrument, there is however a tendency to write questions at the lower knowledge levels of a learning pyramid.
Assessment of the other institutional learning outcomes, however, may be via methods that do not produce numbers which can be quantitatively aggregated. Qualitative aggregation would be needed. No attempt was made to explore qualitative aggregation, but this report will include discussion of an alternate assessment done in one science course that yields qualitative, indirect measurement of student learning.
|
iSLO# |
Category |
Average |
Students will be able to... |
|---|---|---|---|
|
1 |
knowledge |
23% |
define, describe, demonstrate, and explain knowledge within a field of study. |
|
2 |
skills |
0% |
apply, use, perform, exhibit, and demonstrate skills required of a particular career or field of endeavor. |
|
3 |
creativity |
64% |
plan, design, develop, seek, find, synthesize, and create solutions, strategies, documents, and products. |
|
4 |
intellect |
0% |
exhibit the capacity for independent thought and critical thinking. |
|
5 |
communication |
0% |
communicate effectively through writing, speaking, performing, exhibiting, or other forms of expression. |
|
6 |
analysis |
0% |
acquire, interpret, analyze, assess, and evaluate information. |
Table 2: Learning attainment on institutional learning outcomes
Note that all of the mathematics course learning outcomes were mapped to the single mathematics general education core learning outcome. This is in turn mapped to a single institutional learning outcome, creativity. This was proposed in January 2006 and is based on "seek, find, and create solutions."
Program level Student Learning Outcomes
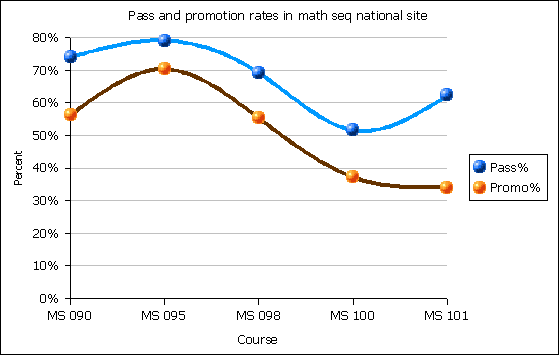
All of the mathematics courses, as noted above, are taken as serving the mathematics general education learning outcome. Thus the 64% reported in table three below represents the overall performance across all level of mathematics delivered by the division, including developmental mathematics. This level of performance on the student learning outcomes agrees well with the known pass rates in the mathematics courses in the division.
Illustration
1: Fall 2004 - Spring 2005 data
Although the possibility of a statistical coincidence cannot be ruled out, the system-wide pass rate for mathematics courses was 67% for fall 2003 and spring 2005. Work done in the previous century suggests that pass rates in mathematics are fairly stable in the 60% to 70% range. The 64% success rate for the mathematics general education student learning outcome is based wholly on item analysis of final examinations where items were mapped back to course level student learning outcomes.
This concurrence between typical, stable, historic pass rates and student learning outcome performance provides no grounds on which to disprove the theory that "qualified faculty delivering courses based on outlines built of student learning outcomes produce trustworthy grades reflective of actual learning by students."
|
avg |
Prgrm |
program Student Learning Outcome: students will be able to: |
|---|---|---|
|
64% |
GenEd |
Define mathematical concepts, calculate quantities, estimate solutions, solve problems, represent and interpret mathematical information graphically, and communicate mathematical thoughts and ideas. |
|
46% |
GenEd |
Define and explain the concepts, principles, and theories of a field of science. |
|
0% |
GenEd |
Perform experiments that gather scientific information and to utilize, interpret, and explain the results of experiments and field work in a field of science. |
|
55% |
HCOP |
Describe the structure, function, and basic pathologies of the human body. |
|
0% |
HCOP |
Communicate health, nutrition, and premedical information in both written and oral formats. |
|
0% |
HCOP |
Describe health care and allied professions. |
|
0% |
HCOP |
Demonstrate a foundation in basic biology, chemistry, microbiology, anatomy, nutrition, health, and physiology. |
|
0% |
HCOP |
Work effectively in groups to solve human life sciences and health problems. |
|
0% |
HCOP |
Quantify and analyze human life sciences and health problems using analytical, statistical, and computer methods. |
|
0% |
HCOP |
Acquire and synthesize human life science, health, and nutrition information in a critical, scientific, and technologically advanced manner. |
|
60% |
MR |
Express the fundamental notions of geological physical, chemical and biological oceanography and exploring these concepts to interpret the marine sciences. |
|
60% |
MR |
Describe the major environments of the world’s oceans (from the nearshore to offshore and from the shallow to the deep) and the interactions with the living forms that inhabit each respective ecosystem within this major water basin. |
|
60% |
MR |
Link the interaction between humans and the world’s oceans, weighing both resource utilization needs (which covers the fisheries and mariculture) and human induced degradation of the marine environment and its counter balance, the examination of the conservation and enhancement measures taken towards the marine environment. |
Table 3: Learning attainment on program student learning outcomes
The HCOP performance is based only on a single course. The assessment was an item analysis of a final consisting solely of matching questions. The result was measurement only of cognition of definitions of terms, with a heavy focus on the structure, function, and basic pathologies of the human body.
A couple of terms of work on assessing the HCOP program indicates that some program learning outcomes are not specifically targeted.
Other HCOP program learning outcomes are not measured directly but are considered to be accomplished by the structure of courses in the program. An example of this is the program learning outcome related to working effectively in groups. All of the laboratory science courses have students working on lab teams. The outcome is being met via the structure of the activities in the course.
A future need of the HCOP program is a re-examination of these program level outcomes to determine whether specific program outcomes should be retained, altered, or eliminated.
The marine science outcomes were also measured by only a single course, and the assessment report provided only a global performance average. That said, the assessment done in the marine science course was a superb example of a formative assessment of whether the instruments used to assess the course matched the student learning outcomes on the outline.
Formative assessment is complex and multi-faceted. Using examinations to measure learning which is then mapped back to outcomes on an outline is only possible if the examination questions align well with the outcomes on the outline. The analysis done in SC 111 Environmental Science explored this question of alignment across a number of instruments in the course. The result will be changes to the outline, and probable modification of some of the assessment instruments. iii
Course level Student Learning Outcomes
The following table reports on the success rate for each course level students learning outcome. Where an outline has general and specific objectives, the general objectives were used. The one exception was for SC 101 where the outline consists of a bank 19 general and 69 specific student learning outcomes. The final examination, in using a matching structure, did not map easily to the 19 general objectives which use language such as explain, describe, and list. The item analysis was aggregated against a topic list derived from the outline.
The construction of table four required a tremendous effort on the part of all faculty in the division. Table four, which underlies the data in table three, does not represent a sustainable mode of assessment. A debt of gratitude is owed to the many faculty in the division who grasped the model proposed in January 2006 and worked long and hard on producing data which could be aggregated.
A number of faculty were familiar with the assessment effort in MS 100 in Kosrae this past summer and went beyond the item analysis by mapping and aggregating their results to the outcomes on the outline. This represented a tremendous effort with faculty working well into the winter holiday break. Observing the labor hours required reinforced the realization that an aggregating approach is not sustainable nor will it scale up across all divisions at all sites.
Table 4 on the next page lists the course, sections from which the data derives, the source of the data (fx is final examination), the number of students (n) and the percentage of questions answered correctly that mapped to the shown course student learning outcome. Note that the number of questions underneath each percentage is not reported.
|
course |
section |
source |
n |
Perc |
cSLO |
|---|---|---|---|---|---|
|
MS 096 |
All |
fx |
68 |
58% |
perform arithmetic operations on numbers, terms, expressions, equations, and inequalities. |
|
MS 096 |
All |
fx |
68 |
56% |
solve and graph linear equations and inequalities. |
|
MS 096 |
All |
fx |
68 |
63% |
solve problems involving ratios, proportions, rates, mixtures, and multiple unknowns. |
|
MS 096 |
All |
fx |
68 |
55% |
perform arithmetic operations on, factor, and graph polynomial expressions. |
|
MS 100 |
g, ll |
fx |
69 |
53% |
Determine the domains of rational functions, find asymptotes, and sketch the graphs of rational functions. |
|
MS 100 |
g, ll |
fx |
69 |
68% |
Evaluate and analyze functions and their graphs including combinations and compositions of functions. |
|
MS 100 |
g, ll |
fx |
69 |
58% |
Graph and solve linear and quadratic equations and inequalities including those with complex roots. |
|
MS 100 |
g, ll |
fx |
69 |
70% |
Sketch and analyze graphs of polynomial functions and mathematical models of variation. |
|
MS 150 |
All |
fx |
52 |
89% |
Calculate basic statistics |
|
MS 150 |
All |
fx |
52 |
61% |
Represent data sets using histograms |
|
MS 150 |
All |
fx |
52 |
62% |
Solve problems using normal curve and t-statistic distributions including confidence intervals for means and hypothesis testing |
|
MS 150 |
All |
fx |
52 |
63% |
Determine and interpret p-values |
|
MS 150 |
All |
fx |
52 |
74% |
Perform a linear regression and make inferences based on the results |
|
SC 101 |
Selected |
fx |
23 |
56% |
topic area: anatomy |
|
SC 101 |
Selected |
fx |
23 |
53% |
topic area: circulation |
|
SC 101 |
Selected |
fx |
23 |
44% |
topic area: digestion |
|
SC 101 |
Selected |
fx |
23 |
60% |
topic area: diseases |
|
SC 101 |
Selected |
fx |
23 |
60% |
topic area: drugs |
|
SC 101 |
Selected |
fx |
23 |
70% |
topic area: immunology |
|
SC 101 |
Selected |
fx |
23 |
49% |
topic area: muscles |
|
SC 101 |
Selected |
fx |
23 |
55% |
topic area: oncology |
|
SC 101 |
Selected |
fx |
23 |
50% |
topic area: physiology |
|
SC 101 |
Selected |
fx |
23 |
52% |
topic area: reproduction |
|
SC 111 |
M11 |
fx (global avg) |
25 |
60% |
Define and give a short history of the environmental sciences. |
|
SC 111 |
M11 |
fx (global avg) |
25 |
60% |
Identify the basic ecological principles and levels of biological organization within the biosphere. |
|
SC 111 |
M11 |
fx (global avg) |
25 |
60% |
Investigate and analyze the various biomes throughout the globe and within or closely linked to the Pacific islands environment. |
|
SC 111 |
M11 |
fx (global avg) |
25 |
60% |
Describe the various resources available such as energy, forest, agricultural products, wildlife and aquatic and how to manage them in a sustainable manner. |
|
SC 111 |
M11 |
fx (global avg) |
25 |
60% |
Identify the solid and hazardous wastes and describe recycling alternatives |
|
SC 111 |
M11 |
fx (global avg) |
25 |
60% |
Discuss global issues on “Island Earth” that affect the Pacific Islands such as air pollution, global warming and acid rain |
|
SC 111 |
M11 |
fx (global avg) |
25 |
60% |
Describe the development of a sustainable global society. |
|
SC 120 |
All |
fx |
39 |
54% |
Demonstrate knowledge of steps or procedures used in the scientific method. |
|
SC 120 |
All |
fx |
39 |
36% |
Demonstrate a working knowledge of the most common units of measurement in the metric system. |
|
SC 120 |
All |
fx |
195 |
72% |
List and outline the functions of at least 10 cell organelles. |
|
SC 120 |
All |
fx |
156 |
39% |
Demonstrate a general understanding of how cells harvest energy by identifying the major compounds entering and exiting the processes of photosynthesis, glycolysis, fermentation, the Krebs cycle, and the respiratory chain. |
|
SC 120 |
All |
fx |
78 |
38% |
List and/or recognize the major stages of mitosis (cell division), identifying the main features of each stage, and be able to compare and contrast this process with that of meiosis (reduction division). |
|
SC 120 |
All |
fx |
117 |
40% |
Solve problems in Mendelian genetics involving monohybrid crosses, dihybrid crosses, sex linkage, multiple alleles (using ABO blood groups as examples), and incomplete dominance. |
|
SC 120 |
All |
fx |
195 |
37% |
List distinguishing characteristics and examples off: bacteria, protozoa, algae, fungi, the major groups of plants (e.g., nonvascular and vascular plants, seed plants, flowering plants), and the major animal phyla. Distinguish between bacteria and viruses and list beneficial and harmful examples of each. |
|
SC 120 |
All |
fx |
156 |
51% |
Demonstrate an understanding of some of the basic terms and concepts of ecology, including community organization and trophic levels, food chains, food webs, ecological pyramids, biological magnification, and prey/predator relationships. |
Table 4: Learning attainment on individual course level SLOs
A further note would be that absence of a course does not necessarily mean that the faculty did not submit assessment information. Some faculty were still working on their assessment analysis late into the winter holiday, more than a week after graduation. As noted, the effort the above analysis required was tremendous and unsustainable.
Year-to-Year
A year-to-year analysis is only possible for a single course, MS 150 Statistics, that performed a similar assessment in December 2005. The overall percentage difference year-to-year was not statistically significant (p-value = 0.71). Student performance on basic statistics remains strong, graphing skills required of histrograms remains weak as do interpretation of p-value and the making of inferences based on linear regressions. This data suggests that students have the ability to learn basic facts and perform fairly strongly tasks that are at the bottom of the learning pyramid. Students appear to have difficulty with interpretation, synthesis, and other higher level thinking skills. Tests that focus on "just the facts and nothing but the facts" often do not well assess these higher thinking skills.
The December 2005 analysis was a part of a study wherein the instructor first listed the areas of student weakness and then performed an item analysis on all examination questions. The instructor's intuition prior to the analysis was compared to the item analysis results and very strong agreement was found. Faculty who mark their own assessment instruments over the course of the term have an accurate internal compass in terms of areas of student strengths and weaknesses.
Specific year-to-year performance results are shown in table five.
|
Fall 06 |
Fall 05 |
change |
course student learning outcomes |
|---|---|---|---|
|
91% |
89% |
3% |
Calculate basic statistics |
|
47% |
61% |
-14% |
Represent data sets using histograms |
|
72% |
62% |
10% |
Solve problems using normal curve and t-statistic distributions including confidence intervals for means and hypothesis testing |
|
62% |
63% |
-1% |
Determine and interpret p-values |
|
61% |
74% |
-13% |
Perform a linear regression and make inferences based on the results |
Table 5: Year-to-year learning attainment in MS 150 statistics
Alternative Approach to Assessment
In SC/SS 115 Ethnobotany a different approach to assessment was taken. The outline was recently rewritten to facilitate the use of a course level portfolio which documents accomplishment of student learning. The portfolio consists of material produced during the fall 2006 running of the course. All material is presented on web pages linked from a single table that acts as an access "portal" to the portfolio. Material includes tests and photographic documentation of activities. The on-line web page table is reproduced in table six minus the embedded hyperlinks. The table only makes "sense" when accessed on line at:
http://www.comfsm.fm/~dleeling/ethnobotany/scss115_assessment63.html
The decision to utilize a portfolio approach was due in part to the lack of a comprehensive final examination to item analyze and map back to the outline. While the analysis is ultimately indirect, the portfolio documents that the course delivered a significant learning opportunity in full alignment with the outline.
|
Botanic objectives |
|
|---|---|
|
Student Learning Outcome |
Assessment |
|
Identify local plants by local and scientific names. |
Midterm
features a practicum component. Hikes also include question and
answer using plants in the field. These field experiences are
documented primarily photographically. Theoretically these oral
field experiences would be best documented as videos, but storage
and sharing of the documentation is considered to be problematic.
Generating web pages with static images appears to be a reasonable
compromise. Ultimately the only way to assess the assessment would
be for an assessor to take students back into the field and query
the students on the plant names. |
|
Compare and contrast the distinguishing reproductive characteristics of different phyla of plants including mosses, seedless vascular plants, gymnosperms, and angiosperms. |
The seedless vascular plant presentations material was assessed in part by questions on test one. Student groups also presented material on gymnosperm, angiosperm life cycles and gymnosperm leaf types. Assessment of gymnosperms included material on the midterm. |
|
Label the key morphological features of the different phyla of plants including mosses, seedless vascular plants, gymnosperms, and angiosperms including the morphology of the reproductive structures. |
The students produced labeled diagrams for seedless vascular plants, gymnosperms, and angiosperms. Walks were taken during which vegetative morphology and floral morphology were dialoged. |
|
Ethnographic objectives |
|
|
Student Learning Outcome |
Assessment |
|
Communicate and describe the healing uses of local plants and the cultural contexts in which that healing occurs. |
The students each brought a plant and gave a presentation to the class on the healing use of that plant. Notes on the presentations as evidence of this outcome are available. |
|
Contribute, participate in, and experience eating local food made from plants and describe the production process. |
Students brought in foods, described the production process, and experienced eating those foods in a set of food presentations. |
|
Communicate and describe the use of plants for transportation, for shelter, and in other material culture applications. |
A lecture-discussion was engaged in on the ways in which plants provide housing, shelter, furnishing, tools, transportation, clothing, decoration, adornment, traditional cosmetic compounds, tatoos, and handicrafts. The class visited a virgin coconut oil processing plant to observe an economically productive use of plants in the realm of material culture. Students made presentations on the material cultural uses of plants in their cultures. |
|
Describe and observe the use, role, and importance of psychoactive plants within their traditional ceremonial cultural contexts. |
Images from a traditional cultural ceremony. [This is a link on the portal page.] |
|
[optional] Participate in the development and maintenance of an ethnobotanical garden. |
Diagram of garden. Ethnogardening fall 2006 [These are links on the portal page.] |
Table 6: A table from a web page portal to on-line course portfolio items
The portfolio provides direct evidence of the learning opportunities for students but no direct evidence of learning. The portfolio also does not provide an obvious way in which to accomplish aggregation. Yet the portfolio can confirm that students accomplished the stated outcomes. Did the student communicate and present? There is photographic and notes evidence that the students did so. Did students identify local plants? Have a look at http://www.comfsm.fm/~dleeling/ethnobotany/e63mx.html, noting the first section of that midterm and the images of the plants present in the laboratory at the bottom of that same page. That the outcomes on the outline were accomplished at a course level is attested to by the evidence in the portfolio.
Plans for Improvement of Learning
Faculty were not asked to produce a plan for improvement in conjunction with the data submitted for this report. For most faculty, simply generating the data required a significant amount of time and effort. Anecdotally, a number of faculty reported on plans for improvement.
The intent of assessment of student learning is to produce a process by which learning in courses is improved. Assessment should lead to changes in outlines, approaches to material in courses, assessment instruments, and other instructional variables. Assessment should reveal learning weaknesses in the students and challenge the instructor to improve the course in those areas.
If every motivated student is successfully learning each and every specified student learning outcome on an outline, then that course can remain stagnant and unchanging decade after decade. The reality is that measures of learning typically reflect the overall average for all course learning outcomes in this study, 57%. Pass rates for most mathematics and science courses are also under 70%.
There is room for improvement in most if not all courses. A course that does not ever change is not taking the necessary risks of curriculum experimentation. Some changes will improve learning – whether measured formally or by the internal understandings of instructors. Other changes may have a neutral or even negative effect on learning. Selecting for changes that improve learning leads to courses which evolve, adapt, and survive.
Next Steps
While individual faculty may have found enough value in this exercise to repeat this process within their own individual courses, the division as a whole is unlikely to re-attempt this form of analysis. Bear in mind that there were faculty in the division who were unable to turn in any assessment results. Ideally assessment is faculty driven, the reality is that ongoing, sustained assessment will require the efforts of support personnel designated and paid specifically to do assessment.
Program assessment via aggregation of actual student learning attainment in the classroom is not viable over the long haul. Programs will have to be assessed by external measures. External measures such as data derived from alumni and employer surveys will provide information on whether graduates have mastered the knowledge sets required of them. Conceivably the college may need to do sampling with standardized tests. Measurement of learning will come from triangulation.
The above does not mean course outlines should not use student learning outcomes. Student learning outcomes, whether micro-skill specific or broader, more comprehensive statements of measurable learnings, provide a way to produce a focused statement of expected learning in a course.
iThis effect was reported on in a document at http://www.comfsm.fm/~dleeling/assessment/20051227.html
iiiReport by Dr. Allain Bourgoin available upon request