19 October 2007
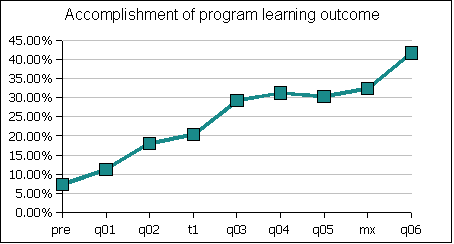
The midterm showed a small uptick in accomplishment of program learning outcomes. Post-midterm the movement into normal curve material saw the beginning of the accomplishment of another course level outcome. This generated an upswing in the accomplishment of the program student learning outcome.
The aggregated item analysis continues to underpin these calculations.
| i | Src | Q | Description | l | Outref | SLO | Corr | Corr% |
| 7 | mx | 1 | level of measure | 1 | 1 | Calculate basic statistics | 28 | 60% |
| 7 | mx | 2 | sample size | 1 | 1 | Calculate basic statistics | 42 | 89% |
| 7 | mx | 3 | min | 1 | 1 | Calculate basic statistics | 47 | 100% |
| 7 | mx | 4 | max | 1 | 1 | Calculate basic statistics | 47 | 100% |
| 7 | mx | 5 | range | 1 | 1 | Calculate basic statistics | 45 | 96% |
| 7 | mx | 6 | median | 1 | 1 | Calculate basic statistics | 43 | 91% |
| 7 | mx | 7 | mode | 1 | 1 | Calculate basic statistics | 46 | 98% |
| 7 | mx | 8 | mean | 1 | 1 | Calculate basic statistics | 40 | 85% |
| 7 | mx | 9 | standard dev | 1 | 1 | Calculate basic statistics | 40 | 85% |
| 7 | mx | 10 | coef var | 1 | 1 | Calculate basic statistics | 38 | 81% |
| 7 | mx | 11 | bin width | 2 | 2 | Represent data sets using charts and histograms | 41 | 87% |
| 7 | mx | 12 | frequency table | 2 | 2 | Represent data sets using charts and histograms | 27 | 57% |
| 7 | mx | 13 | histogram chart | 2 | 2 | Represent data sets using charts and histograms | 33 | 70% |
| 7 | mx | 14 | shape of distribution | 2 | 2 | Represent data sets using charts and histograms | 19 | 40% |
| 7 | mx | 15 | calculate z-score | 1 | 1 | Calculate basic statistics | 33 | 70% |
| 7 | mx | 16 | z ordinary/extraordinary | 1 | 1 | Calculate basic statistics | 32 | 68% |
| 7 | mx | 17 | probability | 1 | 1 | Calculate basic statistics | 31 | 66% |
| 7 | mx | 18 | mean | 1 | 1 | Calculate basic statistics | 28 | 60% |
| 7 | mx | 19 | shape of distribution | 2 | 2 | Represent data sets using charts and histograms | 44 | 94% |
| 7 | mx | 20 | slope | 5 | 5 | Perform a linear regression and make inferences based on the results | 6 | 13% |
| 7 | mx | 21 | intercept | 5 | 5 | Perform a linear regression and make inferences based on the results | 5 | 11% |
| 7 | mx | 22 | positive or negative relation | 5 | 5 | Perform a linear regression and make inferences based on the results | 3 | 6% |
| 7 | mx | 23 | correlation r | 5 | 5 | Perform a linear regression and make inferences based on the results | 3 | 6% |
| 7 | mx | 24 | strength of relationship | 5 | 5 | Perform a linear regression and make inferences based on the results | 13 | 28% |
| 7 | mx | 25 | linear, non-linear, or random | 5 | 5 | Perform a linear regression and make inferences based on the results | 39 | 83% |
| 7 | mx | 26 | coefficient of determination | 5 | 5 | Perform a linear regression and make inferences based on the results | 5 | 11% |
| 7 | mx | 27 | predict y given x | 5 | 5 | Perform a linear regression and make inferences based on the results | 22 | 47% |
| 7 | mx | 28 | predict x given y | 5 | 5 | Perform a linear regression and make inferences based on the results | 22 | 47% |
| 8 | q06 | 1 | calculate z-score | 1 | 1 | Calculate basic statistics | 27 | 63% |
| 8 | q06 | 2 | z ordinary/extraordinary | 1 | 1 | Calculate basic statistics | 29 | 67% |
| 8 | q06 | 3 | probability from normal curve | 3 | 3 | Solve problems using normal curve and t-statistic distributions including confidence intervals for means and hypothesis testing | 25 | 58% |
| 8 | q06 | 4 | probability from normal curve | 3 | 3 | Solve problems using normal curve and t-statistic distributions including confidence intervals for means and hypothesis testing | 16 | 37% |
| 8 | q06 | 5 | probability from normal curve | 3 | 3 | Solve problems using normal curve and t-statistic distributions including confidence intervals for means and hypothesis testing | 22 | 51% |
| 8 | q06 | 6 | x value from normal curve | 3 | 3 | Solve problems using normal curve and t-statistic distributions including confidence intervals for means and hypothesis testing | 17 | 40% |
On aggregation these results yield:
| Outref | Students will be able to: | Sum | Count | Avg |
| 1 | Calculate basic statistics | 36.55 | 64 | 57% |
| 2 | Represent data sets using charts and histograms | 6.45 | 13 | 50% |
| 3 | Solve problems using normal curve and t-statistic distributions including confidence intervals for means and hypothesis testing | 1.86 | 4 | 47% |
| 4 | Determine and interpret p-values | 0 | 0 | 0% |
| 5 | Perform a linear regression and make inferences based on the results | 18.81 | 34 | 55% |
| PSLO | define mathematical concepts, calculate quantities, estimate solutions, solve problems, represent and interpret mathematical information graphically, and communicate mathematical thoughts and ideas. | 41.72% |
Aggregate student success rates on accomplishing the program
student learning outcome continues to show growth. Bear in mind,
as noted in an earlier missive, that mathematically the pslo
cannot reach 100% because the term will always include data from
earlier in the term. A separate analysis is usually done of the
final to look at term's end status without the earlier data.
Laboratory seven which employed working with global positioning satellite receivers and Google Earth ( http://www.comfsm.fm/~dleeling/physci/ps73/lab07photos.html) was followed by a lower technology gradient laboratory eight which focused on observing, recording, and classifying clouds ( http://www.comfsm.fm/~dleeling/physci/ps73/lab08photos.html). Laboratory combined an extremely low tech method of measuring the speed of sound with a pile of technology used to see actual sound wave forms in real time ( http://www.comfsm.fm/~dleeling/physci/ps73/lab09.html).
Laboratories and their write-ups remains a focal in the work load of the course for the students. Each week to date has centered on preparing for the laboratory, doing the laboratory, and then a week later a post-mortem on the laboratory reports themselves. The students are cranking out a paper a week using spreadsheets and word processing software. The students are marked on content as well as grammar,vocabulary, organization, and cohesion. The rubrics for each laboratory are customized to that particular laboratory.
Anecdotally I am seeing improvements in spelling and fewer sentence level grammar errors. I have not been item analyzing the rubric generated laboratory subscores, so I do not have hard numbers on this.
The midterm practical demanded that students generate data from a system and find the mathematical relationship between the variables. The students have only encountered linear relationships and do not know how to find non-linear relationships, as a result a linear relationship was set for the students in laboratory six. The rubric for six gives a good idea of the nature of the rubrics being developed for the course. The laboratory was, as per procedure in the course, turned in a week later. No labs are permitted in handwritten form, all must come in as Microsoft Word or OpenOffice Writer documents.
| 1. [t] Data tables | |
| 2 | Clear and complete, laid out clearly with labels and units |
| 1 | Missing one or more labels or units or other minor issues |
| 0 | Omitted or very unclear, confusing, poorly done, highly incomplete |
| 2. [d] Data display: graphs and charts. | |
| 2 | Use of an xy scatter graph |
| 1 | Use of other, inappropriate, chart type |
| 0 | Omitted |
| 3. [a] Data analysis | |
| +1 | slope |
| +1 | intercept |
| +1 | multiple drops at each height, using the mean bounce |
| +1 | extending to drop heights above 100 cm |
| 4. [c] Conclusions | |
| 4 | Strong reasoning based on the data, logically reasoned, complete and thoughtful |
| 3 | Moderately well-reasoned, or tangential to the data, or based on misconceptions |
| 2 | Overly brief or compromised and impaired by grammar and syntax errors |
| 1 | Unclear, not well reasoned, highly incomplete, or unusually weak |
| 0 | Omitted |
| [G] Grammar and Syntax | |
| 3 | No errors of grammar or word order. |
| 2 | Some errors of grammar or word order but communication not impaired. |
| 1 | Frequent errors |
| 0 | Errors of grammar or word order so severe as to make comprehension virtually impossible. |
| [V] Vocabulary | |
| 3 | Appropriate terms used consistently, clear command of vocabulary with a focus on correct usage of physical science vocabulary, no misspelled words. |
| 2 | Occasionally uses inappropriate terms or relies on circumlocution; expression of ideas not impaired; or a few misspelled words. |
| 1 | Frequent errors in vocabulary or spelling, ability to communicate limited by vocabulary |
| 0 | Vocabulary limitations so extreme as to make comprehension virtually impossible. |
| [O] Organization | |
| 3 | All sections present in the right order |
| 2 | One section missing or out of order |
| 1 | Multiple sections out of order, or turned in as separate spreadsheet and word processing docs |
| 0 | Only one section or no sections apparent. |
| [C] Cohesion | |
| 3 | Ideas flow logically. Connector words assist the reader. |
| 2 | Ideas are disconnected and the conclusion reads more like an outline or answers to a list of questions without connector words. There is a choppy and disjoint sense to the writing style. |
| 1 | Communication impaired by a hodgepodge of inappropriate and misused cohesive structures |
| 0 | Incomprehensible collection of disconnected ideas and words, or only one sentence. |
The laboratories have been a huge amount of work for the students. The lab turn-in rate for laboratory six was 83%. The most recent laboratory to be turned in, seven, had also had a turn-in rate of 83%. For the term to date the rate is 79%.
Performance on the midterm and subsequent quiz was also item analyzed.
| i | Src | Q | Description | Corr | Corr% |
| 7 | mx | 1 | calculate volume box | 22 | 73% |
| 7 | mx | 1 | units | 16 | 53% |
| 7 | mx | 1 | significant digits correct | 6 | 20% |
| 7 | mx | 2 | interpret physical meaning slope | 25 | 83% |
| 7 | mx | 2 | identify units for slope | 21 | 70% |
| 7 | mx | 2 | predict d given t | 18 | 60% |
| 7 | mx | 2 | units | 10 | 33% |
| 7 | mx | 2 | significant digits correct | 11 | 37% |
| 7 | mx | 2 | predict t given d | 15 | 50% |
| 7 | mx | 2 | units | 11 | 37% |
| 7 | mx | 2 | significant digits correct | 14 | 47% |
| 7 | mx | 3 | qualitative marble momentum problem | 30 | 100% |
| 7 | mx | 3 | hypothesize why marbles in equals marbles out in your own words | 2.1 | 70% |
| 7 | mx | 3 | explain how speed in relates to speed out for marble momentum | 1.1 | 37% |
| 7 | mx | 3 | calculate speed | 18 | 60% |
| 7 | mx | 3 | units | 15 | 50% |
| 7 | mx | 3 | significant digits correct | 17 | 57% |
| 7 | mx | 3 | calculate momentum | 15 | 50% |
| 7 | mx | 3 | units | 11 | 37% |
| 7 | mx | 3 | significant digits correct | 13 | 43% |
| 7 | mx | 4 | best heat conductor in lab? | 29 | 97% |
| 7 | mx | 4 | why do you think those substances conducted the most heat? | 1.85 | 93% |
| 7 | mx | 4 | Explain how you think heat moves by conduction. | 1.56 | 52% |
| 7 | mx | 5 | Where are you right now in terms of latitude? | 19 | 63% |
| 7 | mx | 5 | Where are you right now in terms of longitude? | 16 | 53% |
| 7 | mx | 5 | Is that the right latitude and longitude? | 22 | 73% |
| 7 | mx | 5 | How do you know? | 27 | 90% |
| 7 | mx | 5 | How can you determine the right latitude and longitude? | 23 | 77% |
| 7 | mx | 6 | Why do you think nature is mathematical? | 1.43 | 48% |
| 8 | q06 | 1 | Describe the process of condensation | 12 | 40% |
| 8 | q06 | 2 | Describe the process of coalescence | 15 | 50% |
| 8 | q06 | 3 | Describe the process that produces the typical daily rain on Pohnpei | 15 | 50% |
| 8 | q06 | 4 | Explain how we know that the Bergeron process is not occurring | 15 | 50% |
| 8 | q06 | 5 | Sketch a cumulus humilis cloud | 23 | 77% |
| 8 | q06 | 6 | Sketch a cumulonimbus cloud | 3 | 10% |
The ethnobotany class completed a clean-up of the ethnobotanical garden ( http://www.comfsm.fm/~dleeling/ethnobotany/e73/ethnogarden1009.html) followed by a visit to the Haruki village cemetery on a rainy, stormy afternoon. Tuesday the students did presentations on foods of Micronesia (http://www.comfsm.fm/~dleeling/ethnobotany/e73/food.html).
Updates of the assessment matrix ( http://www.comfsm.fm/~dleeling/ethnobotany/e73/assessment.html) with evidence pages is ongoing. At present I am working on the images from the vegetative morphology field experience.