The chart below depicts the average performance gain (or in the case of 8c the average performance loss) from pretest to post-test. The horizontal axis is the question number, the vertical axis is the percentage correct on the post-test minus the percentage correct on the pretest. A mean difference of zero means no change in performance. The vertical blue lines are the extent of the 95% confidence interval. If the vertical lines cross the x-axis, then the change performance from pretest to post-test is not significant.
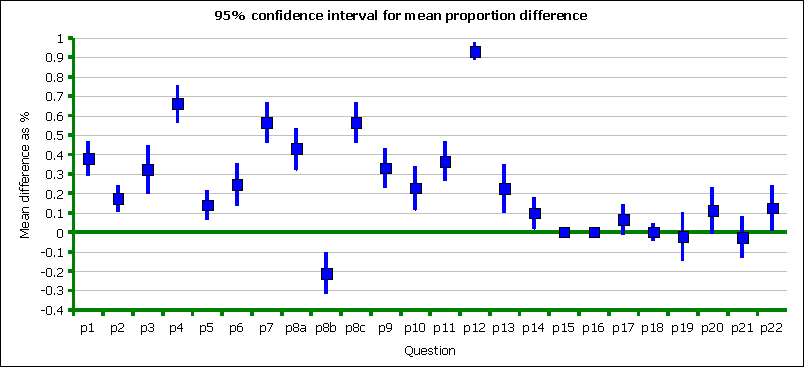
All questions through to and including question number 14 (p14) show statistically significant changes. p8b, determination of the rise, was anomalous in its statistically significant decline from pretest to post-test.
Question twelve, where students were asked to provide the name of the shape of the graph of a quadratic equation (parabola), showed the strongest gains.
Gains above 50% were seen for being able to calculate the range for data, determine the y-intercept for linear data, and determine the slope of a line. In fact, student performance on calculation of the slope exceeded their ability to determine the rise run. This apparent incongruity is due to students using a graph to find the rise and run visually, while using coordinates and a formula to determine the slope. Note that the students were not given the slope formula (y2-y1)/(x2-x1), this was something learned. The rise and run proved more difficult in large part because the chart was not "square." A unit distance on the x-axis was not equivalent to a unit distance on the y-axis.
Clearly the curricula had a positive impact in terms of specific learning. The pretest/post-test does not provide assessment information on the affective domain, an area that is more difficult to assess. The course design included less measurable affective domain outcomes including that students would be able to experience that mathematics can be fun, exploratory, and active. The underlying goal was to build motivation among students who might not be motivated to learn mathematics.