This document has been designed using Microsoft FrontPage 97. This document has only been tested with Microsoft Internet Explorer 3.0 on a Windows 95 machine. This 33K document is an estimated 36 second load at 28.8 Kbps.
In a study of 54 students in MS 100 College Algebra at the College of Micronesia-FSM in
the Fall term of 1997, no correlations could be found between internal measures of success
such as student average and the use of computer software in the math computer laboratory.
This is the second study done at the College that has not found a statistically
significant impact of computing technologies on student learning in math at the College.
The students, however, believe the computer software is valuable in helping them learn
mathematics. Any effect computer technologies might have may be overwhelmed by other
factors affecting student achievement at the College.
In an ongoing examination of the effectiveness of different computer–assisted instructional approaches, 54 students in MS 100 College Algebra at the College of Micronesia–FSM national campus were randomly assigned to two groups of students. All but two of the students in the study were Micronesian. Micronesians are a Western Pacific islanders. For all of the students in the class, English is a second language. The 52 Micronesian students speak languages from one of four major language groups in Micronesia, Chuukese, Kosraen, Pohnpeian, and Yapese.
Both groups used the same textbook series in Houghton Mifflin’s Algebra and Trigonometry series by Larson and Hostetler. The two groups were:
| Name | Description | Software | N |
| Optional | Optional Computer Use outside of class. | Interactive Algebra Tutor and MathView™ | 26 |
| External | Use of computers is assigned and occurs outside of regular class time (externally required). | Interactive Algebra Tutor and MathView™ | 28 |
The Optional group had the option of coming to the computer laboratory outside of class to use either the Interactive Algebra Tutor textbook based CD-ROM software or Maple MathView™ mathematical software. Attendance during open laboratory times was purely voluntary. The instructor encouraged students to come to the laboratory to use the Interactive Algebra Tutor software. The class was held in a regular classroom.
The External group was exposed to both the Interactive Algebra Tutor textbook based CD-ROM software and to MathView™ software. The External group was required to complete external assignments in the computer laboratory and the students were also allowed to come into the computer laboratory to use math software during open laboratory times. The external group was held in a regular classroom. Prior to the midterm the External group was required to come to the laboratory to complete assignments using the Interactive Algebra Tutor textbook based CD-ROM software and the MathView™ software. After the midterm the students were required to complete a second MathView™ assignment in the laboratory.
The mathematics computer laboratory consists of 11 Micron Millennia Pentium 133 MHz computers with 32 MB of RAM and 17 Micron PowerStation Pentium 100 MHz computers with 16 MB of RAM for a total of 28 student computers. All computers used Windows 95 for their operating systems. The Millennia computers were provided by a United States Department of Education Title III grant. The PowerStation computers were provided by the College of Micronesia–FSM. All computers are housed in an air-conditioned room at the Palikir National Campus of the college.
The Houghton Mifflin Interactive Algebra and Trigonometry CD-ROM based software is a companion to the MS 100 College Algebra course textbook, Algebra and Trigonometry, 4th Edition. The Interactive Algebra and Trigonometry software provides multiple choice answers in a drill and practice interface. The Interactive Algebra and Trigonometry software contains sections corresponding to each section of the textbook. The CD-ROM features explanatory sections, short animations, and access to graphing calculators. The problems the student's are presented with are the same as those found in the textbook. The answers given by the Interactive Algebra Tutor include details on how the answer was obtained. This "working out" of the problems is not found in the textbook.
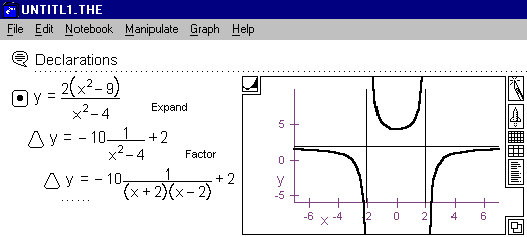
The Waterloo Maple MathView™ software is an open environment for the exploration of mathematics and a development environment for computer based math laboratories. A screen from MathView™ is shown depicting working with two equations in two unknowns and solving them by graphing.
In the Optional group 19 of 26 students (73%) visited the computer laboratory. These nineteen students logged 75 student visits (average of 3 visits per student) to the computer laboratory with a total of 74 hours logged on the computers. The average length of stay was 0.99 hours.
In the External group 23 of 28 students (82%) visited the computer laboratory. These 23 students logged 225 student visits (average of 5.6 visits per student) to the computer laboratory with a total of 263 hours logged on the computers. The average length of stay was 1.17 hours. The External group students were required to the come to the laboratory four times. With only 23 students in the group ever actually coming into the laboratory at an average stay of 1.17 hours, on the order of 108 hours of the 263 logged hours can be attributed to performing required work. The External group logged an additional 155 hours of laboratory time.
Computer use statistics in the two groups, numbers are in hours:
| Software | |||||
| Section | Data | Excel | IAT | MathView™ | Overall Total |
| M13 Optional | Sum | 0 | 66 | 8 | 74 |
| M13 Optional | Count | 0 | 67 | 8 | 75 |
| M13 Optional | Average | 0 | 0.99 | 0.98 | 0.99 |
| M14 External | Sum | 1 | 231 | 31 | 263 |
| M14 External | Count | 2 | 193 | 30 | 225 |
| M14 External | Average | 0.66 | 1.20 | 1.03 | 1.17 |
| Overall Sum | 1 | 297 | 39 | 337 | |
| Overall Count | 2 | 260 | 38 | 300 | |
| Overall Average | 0.66 | 1.14 | 1.02 | 1.12 |
The hours logged in Excel were a single student who started to turn in assignments that required graphs using Excel. This student created these homework assignments without direction from the MS 100 instructor.
Both the M13 1:00 Optional usage section and the M14 2:00 Externally required section used the Interactive Algebra and Trigonometry software about 90% of the time and the Waterloo Maple MathView™ software about 10% of the time. The MathView™ software was also used in conjunction with the Interactive Algebra and Trigonometry software. Students were seen using MathView™ to graph and explore problems given in the Interactive Algebra and Trigonometry software.
A small number of required assignments had a significant impact on the number of hours logged by the two groups. One could hypothesize that the students in both groups were willing to come through the door of the laboratory, but only the students who were required to do work in the laboratory mastered the use of the software. Once the students had mastered the software, the students apparently felt it was useful enough to come back and use it even when it was not required of them.
The students in both groups thought that the software was beneficial to them as revealed in a survey of the students in the two sections that asked the question:
Question : Do you think the math software helped you improve your math skills?
| Helped improve? | Val | M13 | M14 | M13 | M14 | |
| A lot | 1 | 8 | 11 | 42% | 58% | |
| A little | 2 | 10 | 8 | 53% | 42% | |
| Not at all | 3 | 1 | 0 | 5% | 0% |
The distribution of the answers indicates that the M14 externally required group responded more positively to this question. The differences in the distributions, however, are small. The following table finds the average value for each group based on the Val column above. A lower number would mean a stronger self-perception that the math software helped improve math skills.
| Q3 | ||
| M13 | Average: | 1.63 |
| M13 | StDev: | 0.6 |
| M14 | Average: | 1.42 |
| M14 | StDev: | 0.59 |
Although there exists the appearance that the External group self-perceived more benefit (1.42 versus 1.63 for the Optional group) from the computer lab, the large standard deviations rule out statistically significant separation. We can only say there exists the hint of the possibility that requiring use of the lab will cause the students to perceive the lab as being more beneficial.
No statistically significant difference was found in the averages of the two groups at the end of the term. The Optional group attained an average of 58% and the external group attained an average of 64%, these averages are indistinguishable from each other given the small sample size and the variances.
| t-Test: Two-Sample Assuming Unequal Variances | M13 | M14 |
| Mean | 0.58 | 0.64 |
| Variance | 0.03 | 0.05 |
| Observations | 26 | 28 |
| Hypothesized Mean Difference | 0 | |
| df | 50 | |
| t Stat | -1.08 | |
| P(T<=t) one-tail | 0.14 | |
| t Critical one-tail | 1.68 | |
| P(T<=t) two-tail | 0.28 | |
| t Critical two-tail | 2.01 |
Nor was there a correlation between the sum of the hours logged on computers by students and their average in the course. The number of visits to the laboratory also did not correlate with the student averages. The following chart depicts each student's average versus the sum of the number of hours logged in the lab and the number of visits.
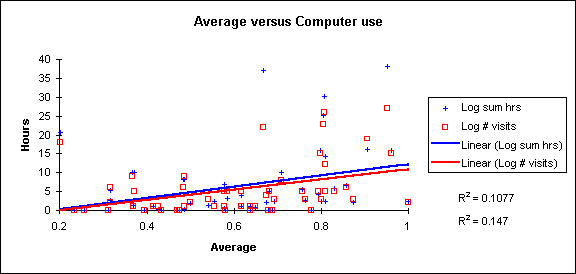
The R² values are in the same order as the data in the legend, both indicate no correlation.
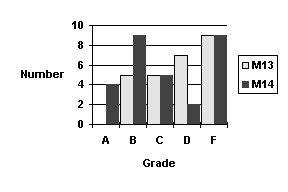
The grade distributions in the two classes were not the same. The same numbers of students attained a failing "F" grade, above an F the distributions are different.
| Grade | M13 | M14 |
| A | 0 | 4 |
| B | 5 | 9 |
| C | 5 | 5 |
| D | 7 | 2 |
| F | 9 | 9 |
Although both classes had the same number of outright failures, the grades above an F distributed quite differently.
The College of Micronesia–FSM is a sociologically complex environment. Pacific Island students from unique non-western cultures are taught in a Western collegiate system primarily by foreigners who neither speak the local languages nor are intimately familiar with the local cultural norms. English is a second language for all students. For many students the College faculty represents their first significant contact with "strangers." In the small population world of a Pacific Island there are no "strangers." Micronesian students in their educational system have not been formally studied. The educational system was inherited from the United States and has been more often impacted by visiting consultants than by internally generated educational studies.
Bearing in mind the above, the following is an exercise in data exploration.
The argument has been made at the College in the past that our students may tend to "give up" if they no longer believe that they can succeed. In the West The Little engine That Could is admired for trying hard at a task that is perceived to be impossible by the engine. For students at the College it may be more important to save face. To persevere when one is at a high risk of not succeeding is seen not as bravery but as foolishness. To have tried and lost is an embarrassment, it is better to not try at all rather than risk ridicule. This also provides an excuse for the student, "Oh, I failed but I wasn't trying." There is no reward for trying hard and failing, there is no social penalty for failing when one does not persevere. Runners here who fall behind in a race drop out rather than continue on for the sake of finishing the race.
Thus there is probable cause for presuming that the failures are students who were no longer making a significant effort in the class and were no longer active students.
In MS 050 Conceptual Approach and in the MS 098 sections run in the Spring of 1997, neither new curricular approaches nor technology had an impact on the failure rates of the courses. This suggests that the cause of student failure is not related to curricula nor to technology but to other factors. This suggests that the solution to retention is elsewhere, possibly, for example, in student support and student services.
The difference in the grade distributions above an "F" suggests that if the students who failed were removed from the data set, then the averages of the two sections might statistically separate.
Equal numbers of students failed in both sections, suggesting that whatever the cause of failure, it was external to and common to both sections. Failure rates was not a variable impacted by the different treatments of the sections. The eighteen students who failed will be removed from the data set to examine whether technology had an impact on the remaining "active" students.
The students who never came to the computer laboratory did not benefit from the technology. What about the students that did come to the laboratory, exclusive of those who did not?
The students say they benefited. The instructor believes, based on nothing more than his involvement, that the computers were beneficial. The question can be asked, did those who remained active in the class, as judged by grades higher than failing, and who used the computers, benefit from the computers? The following analysis removes the students who failed and removes the students who never came to the laboratory. The result is a difference in the averages of the remaining 31 students of one full grade.
| t-Test: Two-Sample Assuming Unequal Variances | M13 | M14 |
| Mean | 0.68 | 0.79 |
| Variance | 0.01 | 0.02 |
| Observations | 15 | 16 |
| Hypothesized Mean Difference | 0 | |
| df | 29 | |
| t Stat | -2.69 | |
| P(T<=t) one-tail | 0.01 | |
| t Critical one-tail | 1.70 | |
| P(T<=t) two-tail | 0.01 | |
| t Critical two-tail | 2.05 |
Did the use of computers cause this one grade difference?
The argument could be made that no correlation was found between a student's average and the number of hours spent using the computers because the students each started from a different skill level. Did the computers contribute to student improvement as measured by the tests given in the course?
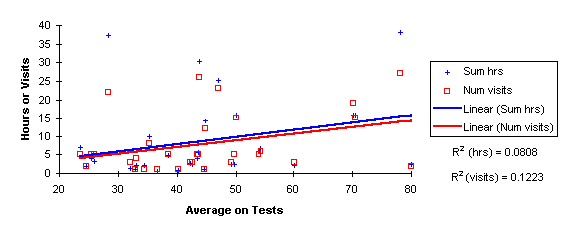
The first test was given on the sixth day of class at the end of the second week. This test covered a limited amount of material and was designed to acquaint students with the style of tests given in MS 100. The averages (out of 100 possible) for each of the subsequent tests for the 31 "active" lab using students suggests that improvement occurred throughout the course:
| Test 2 | Midterm | Test 3 | Test 4 | Final |
| 40.68 | 39.82 | 29.22 | 47.21 | 65.79 |
Overall these 31 students gained at a rate of 6.28 points from Test 2 to the Final. Thus test scores did improve. Do their overall averages reflect either the number of hours spent in the computer laboratory or their number of visits to the computer laboratory?
The following chart plots each students average against the number of hours spent in the laboratory and the number of visits. Correlation was examined using a linear best fit to the data. The R² values indicate a random correlation between averages and both hours spent in the laboratory and the number of visits to the laboratory.
Suppose that one were to make the argument that there is no correlation because each student started from a different level of subject mastery. Then one would want to examine whether the rate of improvement for each student was correlated to computer usage. A best fit linear line was fit to test scores for each of the 31 students. This generated 31 slopes, one for each student's test series. The average slope for these 31 slopes was a positive slope of 6.02.
Only two students experienced a negative best fit line. When considering this data it may be useful to bear in mind that a student who always attains the exact same mark from test to test would have a best fit slope of zero. That the average slope is positive indicates the students did improve on test performance during the course of the term.
If the computers had a significant impact, then it might be hypothesized that there would be a correlation between the rate of gain and computer usage. A steeper slope, a higher rate of gain, should be correlated to higher laboratory usage if computer usage is an underlying cause of the overall improvement in test performance. The following chart plots each student's best fit slope value against their hours of laboratory usage and their number of visits to the laboratory.
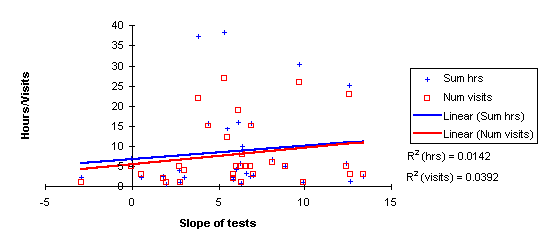
There was no correlation with the rate of rise of their test average and the number of hours logged in the lab nor to the number of visits to the lab. The R² values indicate a random relationship between slope and both hours spent in the laboratory and the number of visits to the laboratory. There is no evidence that computer usage was correlated to test score improvement over the duration of the term. Thus there is no direct evidence that the computers were a cause of the rise in test averages among 31 students who came to the lab and who attained a grade higher than an F.
The use of computers did not cause the one grade difference between the Optional use and Externally required use groups among the 31 "active" students.
In the Spring 1997 MS 098 Study four instructors each taught a section using a different approach. Two of the approaches used included the Optional and External approach. Different instructors taught the Optional and External approach. One of the design goals was to control for the instructor variable by having the same instructor teach the same material in the same manner to both an Optional and External group and then to examine whether differences occurred between the sections.
A separate study will examine the two sections as evaluated by a pretest and posttest to which the instructor was blind.
The statistics generated internally, such as averages and test score improvement, were not correlated to computer usage, even after removing students who may have given up in the course or who did not utilize the computers.
The overall repeat rate, where both D's and F's repeat, is on the same order as the historic repeat rate of roughly 50% in algebraic math classes at the College.
This study echoes the findings of the Spring 1997 study which also found that the use of computer based software was not correlated to performance measures in the MS 098 Transition to Algebra course. In that study, as in this one, the external group had a slightly higher average than the optional group, but variations within the groups precluded statistical significance. In both studies, there was no correlation between performance in the course and to math computer laboratory usage. Even if the differences in the means had been significant, the lack of an underlying correlation would make it difficult to argue that the cause of the difference was the computer technology.
Due to the finding of no significant impact in two studies, this author can see no compelling reason to demand that the department instructors be mandated to use the math computer laboratory. Wherein students believe the laboratory is beneficial, students should not be discouraged from coming to the laboratory during open laboratory hours and using the software.
The argument has been made abroad that the reason studies such this one show no benefit is that the curricula must be changed to reflect the technology before a benefit will be realized. The claim is that the technology changes what ought to be taught and how learning should be measured. Whether curricula ought to be changed has not been openly discussed within the department, however the curricula is being shifted by the technology in some courses.
The curricula for MS 150 Statistics, MS 152 Calculus, and MS 101 Algebra and Trigonometry have all been affected by software such as Microsoft Excel and Waterloo Maple MathView™. Topics are being taught utilizing new approaches and with new forms of exercises not previously possible without the technology. This evolution will continue with developmental work in the Spring of 1998 on computer based MathView™ laboratories for MS 101 Algebra and Trigonometry.
Title III Math/Science Specialist Dana Lee Ling
Department of Mathematics and Natural Sciences Chair Stephen Blair
08 January 98
This study was made possible by the support of the College of Micronesia–FSM, a United States Department of Education Title III grant, and by funding provided by the Congress of the Federated States of Micronesia.
Department of Mathematics and Natural Sciences
College of Micronesia–FSM
mathscience@mail.fm
Return to home page
Page comments