
This report designed with Microsoft FrontPage 97 and tested only with Microsoft Internet Explorer 3. This report is on the order of 12 paper pages in length and reading may be easier from a hard copy print out.
In a study of 98 Pacific island English as a Second Language students in a pre-collegiate 16 week mathematics course at the College of Micronesia–FSM, the use of computer based learning technologies was not found to have a significant impact on student performance as measured by an internal pre-test and post-test of basic algebraic knowledge. Student gains between the pre-test and the post-test were also not correlated to the number of hours of use of the computer based learning technologies.
To assess the effectiveness of different computer–assisted instructional approaches, 98 students in MS 098 Transition to Algebra at the College of Micronesia–FSM national campus were randomly assigned to one of four groups of students. The students in the study were all Micronesian. Micronesians are a Pacific island group of peoples. For all of the students in the class, English is a second language. The 98 students speak languages from one of four major language groups in Micronesia, Chuukese, Kosraen, Pohnpeian, and Yapese.
All four groups used the same textbook series in Houghton Mifflin’s Introductory Algebra series by Aufmann et al. The four groups were:
| Group | Long Name | Description | Software | n |
| Ctrl | Control | No computer use | None | 23 |
| Opt | Optional | Optional Computer Use outside of class. | Algebra Tutor | 30 |
| Int | Internal | Use of computers during class time with optional use of computers outside of class | Algebra Tutor | 21 |
| Ext | External | Use of computers is assigned and occurs primarily outside of regular class time | Algebra Tutor and MathView | 24 |
The Control group had no access to computers. The Control group was taught outside of the computer laboratory using a more traditional lecture based format. The Control group classroom, like all non-computer classrooms at the College, is not air-conditioned.
The Optional group had the option of coming to the computer laboratory outside of class to use drill and practice algebra software. Attendance during open laboratory times was purely voluntary. The instructor encouraged students to come to the laboratory to use the Algorithmic Algebra Tutor software. The class itself was held in the air-conditioned computer laboratory, thus the student’s were well aware of the existence of the laboratory and the computers.
The Internal group used the computers on a daily basis inside of class. The instructor allowed, with guidance, students to proceed at their own pace through the drill and practice Algorithmic Algebra Tutor software package. The Internal group also had available the option of coming to computer laboratory during open laboratory times.
The External group was exposed to both the Algorithmic Algebra Tutor and to MathView™ software. The External group was required to complete external assignments in the computer laboratory and the students were also allowed to come into the computer laboratory to use math software during open laboratory times.
Students who did not complete either the pre-test or the post-test were not included in the pre-test/post-test study statistics. These students were included in the computer use hours study.
Measurement Instrument
The measurement instrument is based on a placement test used in previous years at the college. The placement test consists of 15 questions at the MS 098 Transition to Algebra level in mathematics. The test was administered at the start of the term and at the end of the term.
Equipment and Software
The mathematics computer laboratory consists of 11 Micron Millennia Pentium 133 MHz computers with 32 MB of RAM and 17 Micron PowerStation Pentium 100 MHz computers with 16 MB of RAM for a total of 28 student computers. All computers used Windows 95 for their operating systems. The Millennia computers were provided by a United States Department of Education Title III grant. The PowerStation computers were provided by the College of Micronesia–FSM. All computers are housed in an air-conditioned room at the Palikir National Campus of the college.

The Houghton Mifflin Algorithmic Algebra Computer Tutor software is a companion to the MS 098 Transition to Algebra course textbook, Introduction to Algebra with Basic Mathematics, 2nd Edition. The Algebra Tutor provides multiple choice answers in a drill and practice interface. The Algebra Tutor contains sections corresponding to each section of the textbook. A typical student problem, taken from linear equations, is shown.
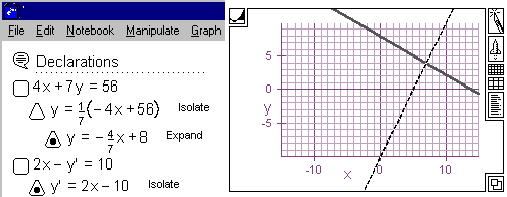
The Waterloo Maple MathView™ software is an open environment for the exploration of mathematics and a development environment for computer based math laboratories. Structure was provided by the development of mathematical laboratory notebooks using MathView. Only the External group used this software. A screen from MathView is shown depicting working with two equations in two unknowns and solving them by graphing.
Raw Data
PreTest Scores, PostTest Scores, Differences
The raw scores and differences on the 15 question pre-test and post-test are given below.
| Control | Optional | Internal | External | Differences | |||||||
| Pre | Post | Pre | Post | Pre | Post | Pre | Post | Ctrl | Opt | Int | Ext |
| 9 | 7 | 8 | 8 | 11 | 10 | 7 | 14 | -2 | 0 | -1 | 7 |
| 5 | 9 | 12 | 14 | 7 | 10 | 9 | 13 | 4 | 2 | 3 | 4 |
| 8 | 9 | 8 | 10 | 5 | 7 | 9 | 12 | 1 | 2 | 2 | 3 |
| 5 | 7 | 3 | 5 | 6 | 10 | 9 | 12 | 2 | 2 | 4 | 3 |
| 9 | 9 | 9 | 9 | 8 | 11 | 10 | 11 | 0 | 0 | 3 | 1 |
| 3 | 5 | 9 | 9 | 9 | 9 | 10 | 11 | 2 | 0 | 0 | 1 |
| 7 | 11 | 4 | 10 | 9 | 10 | 6 | 11 | 4 | 6 | 1 | 5 |
| 8 | 8 | 10 | 12 | 7 | 8 | 10 | 10 | 0 | 2 | 1 | 0 |
| 7 | 9 | 8 | 11 | 7 | 8 | 8 | 10 | 2 | 3 | 1 | 2 |
| 7 | 10 | 13 | 12 | 5 | 5 | 6 | 10 | 3 | -1 | 0 | 4 |
| 5 | 10 | 9 | 10 | 6 | 12 | 8 | 9 | 5 | 1 | 6 | 1 |
| 10 | 9 | 6 | 9 | 7 | 6 | 8 | 9 | -1 | 3 | -1 | 1 |
| 5 | 8 | 10 | 12 | 10 | 11 | 5 | 9 | 3 | 2 | 1 | 4 |
| 7 | 10 | 6 | 1 | 7 | 9 | 4 | 9 | 3 | -5 | 2 | 5 |
| 8 | 10 | 8 | 10 | 4 | 8 | 10 | 8 | 2 | 2 | 4 | -2 |
| 5 | 5 | 8 | 10 | 7 | 10 | 10 | 8 | 0 | 2 | 3 | -2 |
| 9 | 11 | 8 | 7 | 4 | 10 | 8 | 8 | 2 | -1 | 6 | 0 |
| 9 | 10 | 5 | 8 | 11 | 14 | 7 | 7 | 1 | 3 | 3 | 0 |
| 3 | 9 | 10 | 12 | 4 | 7 | 6 | 7 | 6 | 2 | 3 | 1 |
| 6 | 10 | 6 | 6 | 10 | 8 | 4 | 7 | 4 | 0 | -2 | 3 |
| 10 | 13 | 6 | 8 | 5 | 10 | 4 | 7 | 3 | 2 | 5 | 3 |
| 7 | 6 | 9 | 9 | 3 | 6 | -1 | 0 | 3 | |||
| 9 | 10 | 10 | 6 | 4 | 5 | 1 | -4 | 1 | |||
| 8 | 8 | 3 | 2 | 0 | -1 | ||||||
| 5 | 5 | 0 | |||||||||
| 1 | 12 | 11 | |||||||||
| 5 | 10 | 5 | |||||||||
| 10 | 11 | 1 | |||||||||
| 9 | 12 | 3 | |||||||||
| 5 | 5 | 0 | |||||||||
Computer use statistics in the four groups:
| Internal | External to Class Usage Statistics | ||||
| Group | Total in-class computer use/hrs | Total out of class computer use/hrs | Average length of stay in the lab for a student/hrs | Avg. total ext. hours per student who came into lab/hrs | Percent of students in class participating in external lab |
| Ctrl | 0 | 0 | 0 | 0 | 0 |
| Opt | 3.6 | 0.90 | 0.9 | 13% | |
| Int | 798 | 49.3 | 1.24 | 3.8 | 62% |
| Ext | 96 | 228.0 | 1.12 | 6.7 | 96% |
The Optional computer use group saw almost no computer usage. Four students of thirty in the class came in for a little less than an hour per person during the entire term. The Internal group students logged 798 in-class hours (38 class hours × 21 students) on the computers and another 49.3 hours (sum of all student-hours) on computers outside of class. The Internal group had a total of 847 hours on the computers. Where in the Optional group few students came to the laboratory outside of class, for the Internal group two-thirds of the students in the class came to the laboratory during non-class time. The External group logged 96 in-class hours (4 class hours × 24 students) on the computers and another 228 total hours on computers outside of class. The External group had a total of 324 hours on the computers.
The four groups had the following statistical results, where the means given are in number of questions answered correctly. The measurement instrument consisted of 15 questions as previously described.
| Group | Pre-Test Mean | Post-Test Mean | Difference |
| Ctrl | 7.00 | 8.91 | 1.91 |
| Opt | 7.60 | 9.03 | 1.43 |
| Int | 7.10 | 9.19 | 2.10 |
| Ext | 7.00 | 8.96 | 1.96 |
The difference in the post-test and pre-test scores are significant for all four groups when tested with a paired t-test two sample for means.
| Ctrl Pre | Ctrl Post | Opt Pre | Opt Post | Int Pre | Int Post | Ext Pre | Ext Post | |
| Mean | 7.00 | 8.91 | 7.60 | 9.03 | 7.10 | 9.19 | 7.00 | 8.96 |
| Variance | 4.27 | 3.72 | 7.01 | 7.96 | 4.99 | 4.26 | 5.91 | 7.26 |
| Observations | 23 | 23 | 30 | 30 | 21 | 21 | 24 | 24 |
| Pearson Correlation | 0.49 | 0.45 | 0.46 | 0.61 | ||||
| Hypothesized Mean Difference | 0 | 0 | 0 | 0 | ||||
| df | 22 | 29 | 20 | 23 | ||||
| t Stat | -4.540 | -2.744 | -4.298 | -4.219 | ||||
| P(T<=t) one-tail | 0.000 | 0.005 | 0.000 | 0.000 | ||||
| t Critical one-tail | 1.717 | 1.699 | 1.725 | 1.714 | ||||
| P(T<=t) two-tail | 0.000 | 0.010 | 0.000 | 0.000 | ||||
| t Critical two-tail | 2.074 | 2.045 | 2.086 | 2.069 |
The improvement in student performance on the test was significant for all four groups. All four groups showed a statistically significant gain between the pre-test and the post-test. The net gain was roughly the same for all four groups. All four treatments were beneficial.
The differences in the means for the four groups were not separated from each other on a single factor ANOVA:
| Groups | Count | Sum | Average | Variance |
| Ctrl | 23 | 44 | 1.913 | 4.083 |
| Opt | 30 | 43 | 1.433 | 8.1851 |
| Int | 21 | 44 | 2.095 | 4.9905 |
| Ext | 24 | 47 | 1.958 | 5.1721 |
| Source of Variation | SS | df | MS | F | P-value | F crit |
| Between Groups | 6.733 | 3 | 2.244 | 0.3864 | 0.763 | 2.7014 |
| Within Groups | 546 | 94 | 5.808 |
Variation within the groups exceeded variation between the groups. At the group sizes, the random noise of individual student variations drowns out any signal that any one group performed differently from any other group. The four treatments were equally beneficial and no treatment had a differential effect on the improvement in the mean.
The average improvement in the mean across all four groups was a difference of 1.85. As the improvements in the means for the four groups were not statistically separated, the four groups can be considered to be statistically equivalent to a net gain in the mean of 1.85 for all students. The standard deviation in the difference data across all four groups was 2.35. Using the mean improvement of 1.85 and the standard deviation of 2.35, histogram bins can be constructed to examine the distribution of the differences about the mean for each group. The differences are always an integer value for each student, hence the bins require integer boundaries. Thus the mean is taken to be 2 (@ 1.85) and the standard deviation is also 2 (@ 2.35). Thus the histogram distribution starts from 2 and the bins have a span of 2 each. The resulting data can be converted to percentages to remove the effects of the different group sizes.
| Bins | Ctrl | Opt | Int | Ext | Bins | Ctrl | Opt | Int | Ext | |
| -2.00 | 1 | 2 | 1 | 2 | -2.00 | 4% | 7% | 5% | 8% | |
| 0.00 | 5 | 10 | 4 | 4 | 0.00 | 22% | 33% | 19% | 17% | |
| 2.00 | 8 | 11 | 6 | 7 | 2.00 | 35% | 37% | 29% | 29% | |
| 4.00 | 7 | 4 | 7 | 8 | 4.00 | 30% | 13% | 33% | 33% | |
| 8.00 | 2 | 2 | 3 | 3 | 8.00 | 9% | 7% | 14% | 13% | |
| More | 0 | 1 | 0 | 0 | More | 0% | 3% | 0% | 0% | |
| Sum | 23 | 30 | 21 | 24 |
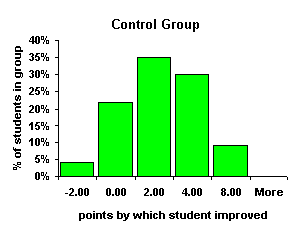
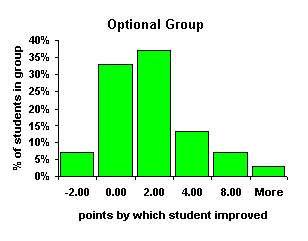
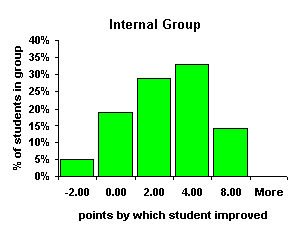
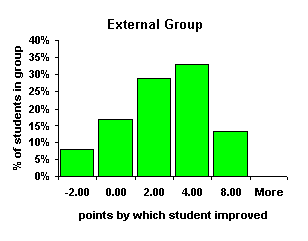
The Control group is roughly normal about the mean with a skewness of only –0.02. The Optional group had the largest skewness at 0.87 and the distribution is peaked at the center with a kurtosis of 4.06, the largest kurtosis of the four groups. Both the Internal and External group are slightly right shifted normal curves. The Internal group had a skewness of 0.05, the External group was slightly more skewed to the right with a skewness of 0.15. The Internal and External groups are visually consistent with each other. Bearing in mind that the Optional group is effectively a "no computer use" group based on computer contact hours, the Internal and External groups are separable as the groups that used the computer. The similarity of the distributions above suggests the computers had a like effect on the students whether used internally or externally. The closeness of the Internal and External curves can be shown more clearly by superimposing the data for all four groups onto a single graph and graphing the data with smoothed lines.
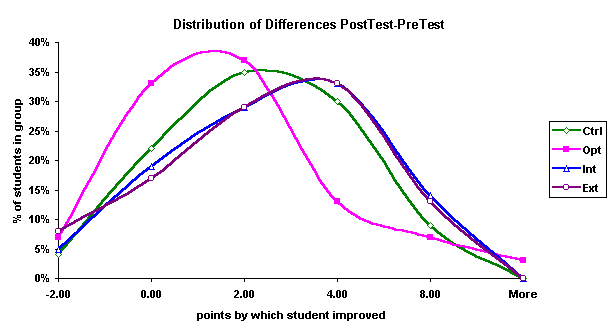
If the Control and Optional group difference data is combined, and the Internal and External group difference data is combined, there is still no statistical difference between the means on a t-test. The internal variation is simply too large to sort out relatively small movements in the mean from the pre-test to the post-test. There is only the hint that the computer based courses may have been slightly more effective at increasing the gain made by students between the pre-test and the post-test.
The negative valued bin, –2.00, indicates that there were students who regressed during the term. One of the impressions held by the instructors is that there were students who had simply "given up" on mathematics. These students are seen as going through the motions of attending class but may have already mentally "resigned" from the class. This effect is sometimes attributed in part to the students having a poor foundation in mathematics prior to coming to the College. Another cause that has been documented only anecdotally is students who have come to College for social or financial reasons. Whatever the cause, there appear to be students who lose the motivation to learn and they mathematically collapse in any of the currently offered curricula. The collapse is in some cases profound, offsetting gains by students who are still actively involved in the class. Hence large movements in the mean under current curricula are difficult to attain.
As there is no statistically significant difference between the groups, a correlation between hours of computer use and group means is not statistically relevant. The only analysis that can be made of the relationship between computer usage hours and student improvement on the test is that there was no difference between the Internal group’s mean and the External group’s mean despite the difference in the number of hours. The Internal group logged a total of 847 student-hours on the computers, while the External group logged a total of 324 student-hours on the computers. That the groups did not perform differently indicates that either approach is equally beneficial. Assigning students to use the laboratory outside of class time is equally effective as using the computers during class. Note that the students must be required to use the laboratory: the lack of computer use by the optional use group has shown that student’s will only use the laboratory when required to do so.
During the last nine days of school, eight students in the External group logged 19.4 hours in the computer laboratory. These eight students included both academically strong and weak students. These students were in no way statistically special, scoring an average 8.63 on the post-test (Ext group average 8.96) and averaging a gain of 1.88 (with a standard deviation of 2.95) between the pre-test and post-test (Ext group average 1.96, standard deviation 2.27). Only one Internal group student came to laboratory and he logged a single hour. The laboratory attracted only External group students for out-of-class brush-up and studying at the end of the term, and it attracted students from a range of mathematical capabilities.
The External group students had been required to come to the laboratory outside of class, apparently became accustomed to coming to the laboratory outside of class, and they continued to do so voluntarily later in the term. The Internal group apparently had not become accustomed to coming to the laboratory and thus did not utilize the software available in the laboratory to assist in studying for their final. The Internal group had heavily utilized the Algorithmic Algebra Tutor and their in-class examinations were closely aligned with the text and the software they were using. The Optional group was essentially a no-show in the laboratory through-out the term and continued that pattern in not utilizing the laboratory at the end of the term. Student time on task working with math outside of class can be "purchased" by requiring lab usage outside of class.
That the External group experienced a gain no different than the Internal group is good news for the College as the College does not have the space to hold every math class in the Math computer laboratory. The above data supports the equal benefit of continuing to keep the laboratory as class-free as possible to maximize the open laboratory time and thereby maximizing the number of students who can access the computers. There is also possibly a benefit at the end of the term with having had the students being required to come to the laboratory external to class: the students turned to the laboratory to study for their final examination.
For this portion of the study the data for the External group only will be used to examine whether a differing number of hours logged on the computers yielded different results. The reason for limiting this portion of the study to the External group is given below.
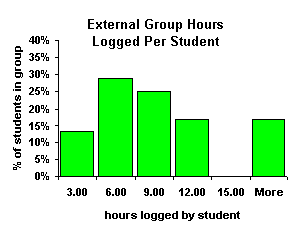
The External group had the larger variation in the number hours per student logged in the laboratory. The Internal group logged the bulk of their hours (94%) together with each student logging at least 38 hours. The External group logged a lesser amount of class time on the computers (30%). The External group also logged a widely varying amount of time outside of class on the computer, and this variable time was the larger part of their computer experience. Students in the External group logged everything from 0 hours of computer time outside of class to 24 hours of computer time outside of class. The mean number of hours logged on computers outside of class per student was 8.57 hours with a standard deviation of 6.38 hours. The large standard deviation appears to be due to four students with 17, 19, 23, and 24 logged hours along with two students who logged 0 and 1 hour. The actual distribution is as shown.
The External group is the only group that has a strong variation in the number of hours of computer use.
The Correlation Between Hours Logged and Improvement
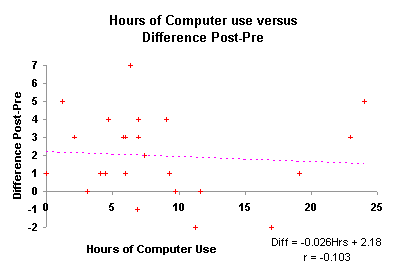
The correlation between the number of hours logged and the difference data is –0.10. There is no correlation, there is only a random relationship between the number of hours logged on computers outside of class and improvement between the pre-test and the post-test. This result, coupled with the lack of separation in the means between the groups, argues that the computers in and of themselves had no impact, positive or negative, on mathematics achievement during the Spring of 1997.
The scatter chart shown visually depicts the lack of a relationship between hours of computer use and the gain between the post-test and pre-test. The best fit line is meaningless given the random correlation. From a mathematical perspective, computer use and student achievement are independent variables.
The use of computer based learning technologies were not found to have a significant impact on student performance as measured by an internal pre-test and post-test of basic algebraic knowledge. Student gains between the pre-test and the post-test were also not correlated to the number of hours of use of the computer based learning technologies.
There is not, however, a complete lack of evidence that computer based learning has no beneficial impact on students. The Internal group heavily utilized a computer based curricula that consisted of primarily self-paced student learning using the Algorithmic Algebra Tutor software. That the Internal group performed equally well with this approach is an indication that computer based learning is at least equal in effectiveness to a non-computer based classroom.
The instructors of the Internal and External group both noted that there may have been a misalignment between the test instrument and the material emphasized in their curricula. The computers provided an opportunity to focus more heavily on the graphing aspects of the textbook while the measuring instrument featured no graphing questions. This was in part necessary as the Control group did not have access to either computers or graphing calculators, hence graphing was not emphasized in the control group. Despite the emphasis on graphing in the Internal and External group, the material on the measuring instrument was covered by all courses.
All of the instructors felt that many other factors are involved in student success and motivation in mathematics at the College. From this perspective, the computers are simply not a significant variable that affects individual student performance. The following is an example of why a student might be at the college for non-academic reasons. Nearly all of the students are supported by a U.S.D.O.E. Title IV Pell grant and by state scholarship funds. Students are also eligible for College Work Study jobs. A student may receive on the order of US $1000 a year in cash through these programs. The national per capita income is estimated at US $1800 to US $1900, the minimum wage is US $1.50. The Federated States of Micronesia is a developing nation with few job opportunities and half of the population under the age of 18. Going to College here is not necessarily a financial burden, on the contrary, it is one of the higher paying "jobs" a young adult can secure. Thus a student’s motivation for going to College may not be academic.
The students in each of the four groups who go on to MS 100 Algebra, the College’s first college level algebra course, will be followed to have a crude look at potential long term effects of the four treatments.
Title III Mathematics
Title III Math/Science Specialist Dana Lee Ling
Department of Mathematics and Natural Sciences Chair Stephen
Blair
Dr. Anca Dema
John Gann
This study was made possible by the support of the College of Micronesia–FSM, a United States Department of Education Title III grant, and by funding provided by the Congress of the Federated States of Micronesia.
Department of Mathematics and Natural Sciences
College of Micronesia–FSM
P.O. Box 159 Kolonia
Pohnpei FM 96941-0159
Return to home page
Page comments