032 • Name:
| body fat index |
|---|
| 30.8 |
| 30.0 |
| 45.2 |
| 42.6 |
| 17.1 |
| 50.3 |
| 34.6 |
| 46.4 |
| 33.1 |
| 14.3 |
| 44.6 |
| 38.2 |
| 19.1 |
| 32.5 |
| 30.8 |
| 18.6 |
| 30.5 |
| 41.4 |
| 45.3 |
| 35.2 |
| 43.1 |
| 29.1 |
| 39.6 |
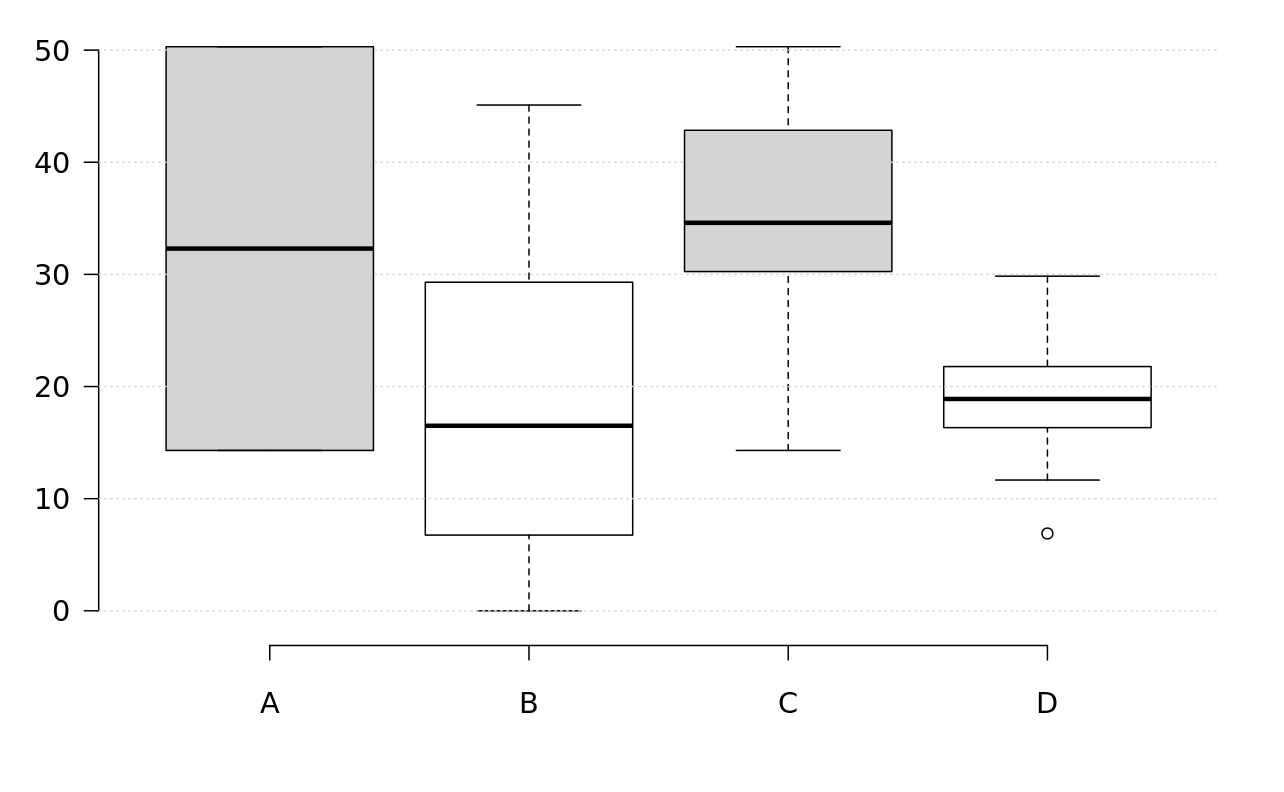
- The data for this quiz is the following female body fat index values. Determine the level of measurement for the data:
-
Determine the sample size:
-
Determine the mode:
-
Determine the median:
-
Calculate the mean and enter your answer rounded to two decimal places:
-
Determine the minimum:
-
Determine the maximum:
-
Calculate the midrange:
-
Calculate the first quartile using the spread sheet function value:
-
Calculate the third quartile using the spread sheet function value:
-
Calculate the InterQuartile Range:
-
Which of the following box and whisker plots correctly displays the data?
-
Calculate the sample standard deviation sx and enter your answer rounded to two decimal places.
-
Calculate the sample coefficient of variation CV and enter your answer rounded to two decimal places.
-
A body fat index of 39 is the lower limit for an obese level of body fat for a female. Calculate the z-score for a body fat index of 39 and round the answer to two decimal places.
-
Is the z-score for a female body fat index of 39 ordinary or extraordinary relative to the data provided?
-
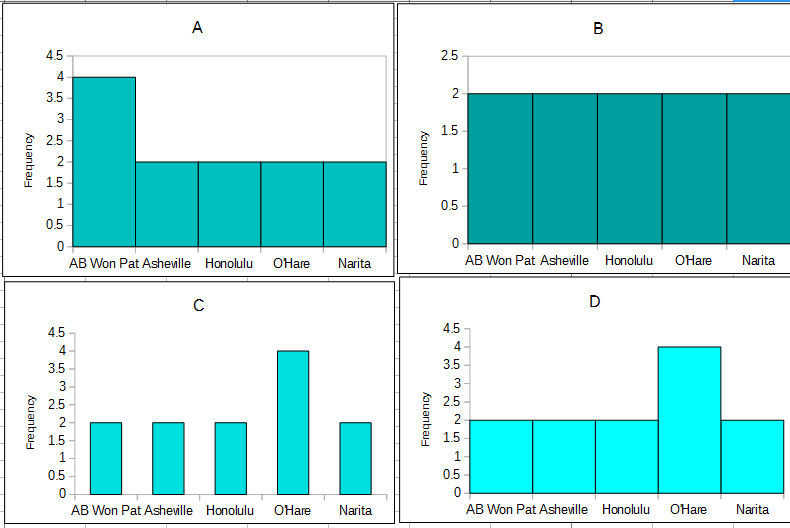
The following is a list of airports I visited in October and December 2014 in the order I visited them:
| Airports |
|---|
| Honolulu |
| O'Hare |
| Asheville |
| Asheville |
| O'Hare |
| Narita |
| AB Won Pat |
| AB Won Pat |
| Narita |
| O'Hare |
| O'Hare |
| Honolulu |
Use this data to fill in the following frequency and relative frequency table:
| Airport | Frequency | Relative Frequency |
|---|
| AB Won Pat | | |
| Asheville | | |
| Honolulu | | |
| O'Hare | | |
| Narita | | |
-
Which of the following is the correct frequency histogram for the airport data?