
The Mile-A-Day moms were recently covered in the Kaselehlie Press. MAD moms commit to running, or walking depending on their own physical capacities, a mile a day for 41 consecutive days. If they skip a day, they start their count over. Originally comprised primarily of mothers with heritages here on Pohnpei, the movement has grown to over 350 participants organized into subgroups such as MAD moms of Kapinga, Pingelap, Mwoakilloa, Texas, Yap, RMI, and Chuuk. Currently the MAD moms are engaged in a 37 day run streak from Thanksgiving to the New Year.
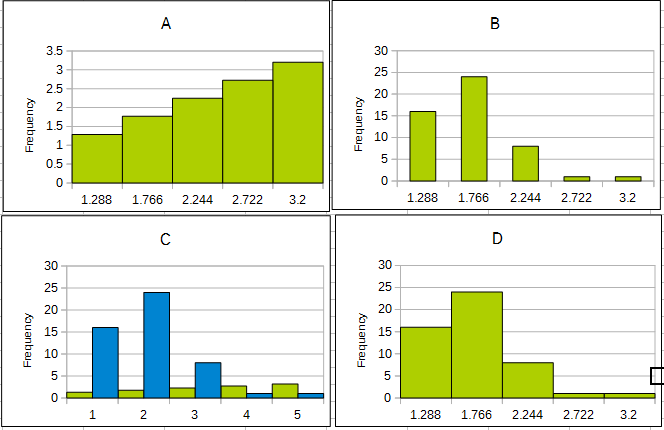
The first section of this final examination uses the average number of miles per day being run by fifty active member of the MAD moms. The data suggests that the MAD moms, on average, complete more than a mile a day. The data is in the following table. Use all fifty data values in the five columns and ten rows of this table.
Miles per day for fifty participants
1.55	2.51	1.03	1.03	1.21
1.63	1.44	1.07	1.50	0.96
1.78	1.34	1.11	1.86	1.44
1.93	2.08	1.32	1.65	1.34
1.78	1.30	1.55	1.04	1.87
1.12	1.59	0.99	1.16	1.55
1.64	1.30	1.53	1.08	1.34
1.85	3.20	1.98	1.39	1.24
0.81	1.69	1.52	1.13	1.36
1.26	1.32	1.58	1.59	1.21
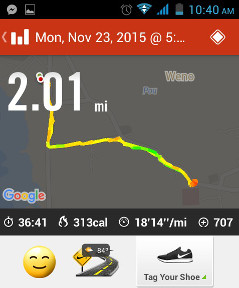
Some of the MAD moms continue their run streak beyond 41 days. Of interest from a sports science perspective is whether the MAD moms are able to complete their mile faster as their streak continues. In other words, are they gaining fitness and if so, at what rate? The MAD moms use a Nike+ running app on their Android smart phones that reports distance, duration, and pace. Pace is the number of minutes to complete a mile. The smaller the pace, the faster the runner. The following table is for an anonymous MAD mom. The first column is the day of the streak, the second is her time to complete one mile in decimal minutes. The table includes selected data from day one to day 95.
Day	Pace
01	20.4
08	19.3
17	18.2
27	17.1
51	16.3
82	15.8
95	14.1
Open Data Exploration
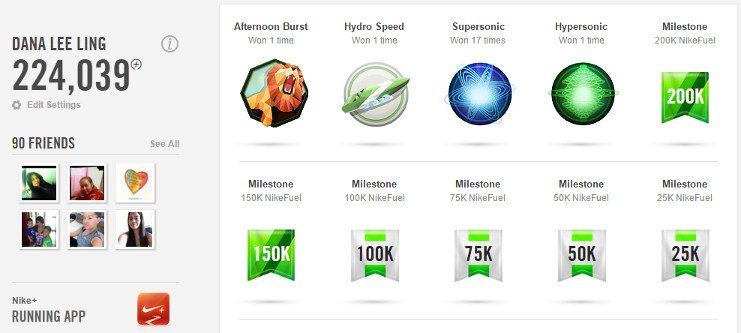
The Nike+ running app provides data to the runner on their distance, duration, pace, calories burned, and NikeFuel. NikeFuel is a measure of activity, but Nike will not say how NikeFuel is calculated by the Nike+ running app. Runners are awarded banners for achieving certain NikeFuel milestones. In the above image one can see that I have 224,039 NikeFuel. This open data exploration asks you to determine what running variable the NikeFuel calculation is based on.
The Nike+ running app reports distance (Dis), pace, duration, along with the NikeFuel ("Fuel") earned during a run. This data is reported for 22 runs in the table below.
Is NikeFuel calculated based on the distance, the pace, or the duration (total run time)?
Provide numeric statistical support for your answer to the following questions. Use the single blank to write up your answers to the questions including the statistical support for your answers. Do not just give me a one word answer, give me numeric statistical support for why your answer is correct.
Fuel	Dis	Pace	Duration
1073	2.5	09.82	25.27
3074	7.6	11.53	88.65
2013	4.8	09.58	46.18
0287	0.7	07.77	5.47
1111	2.6	11.6	31.3
1082	2.6	09.97	25.98
3400	8.2	10.32	84.92
1457	3.5	10.73	37.82
1236	2.9	10.07	29.97
2171	5.2	10.82	56.87
0460	1.1	09.85	11.22
0702	1.6	09.00	15.25
2314	5.5	09.97	55.43
0432	0.9	09.95	9.47
2006	4.8	10.17	49.1
1456	3.5	09.88	35
0615	1.4	09.92	14.82
1541	3.7	09.47	35.85
1263	3.0	10.00	30.68
2060	5.0	09.68	49.12
1083	2.6	10.27	26.77
1288	3.2	09.58	30.8
Do not simply write down any and all statistics you have ever learned. Cite specific statistics or charts that support that answer. When citing a statistic or statistics, include both the name of the statistic, the numeric value, and why that statistic is meaningful.