Original document privately held in Schoology
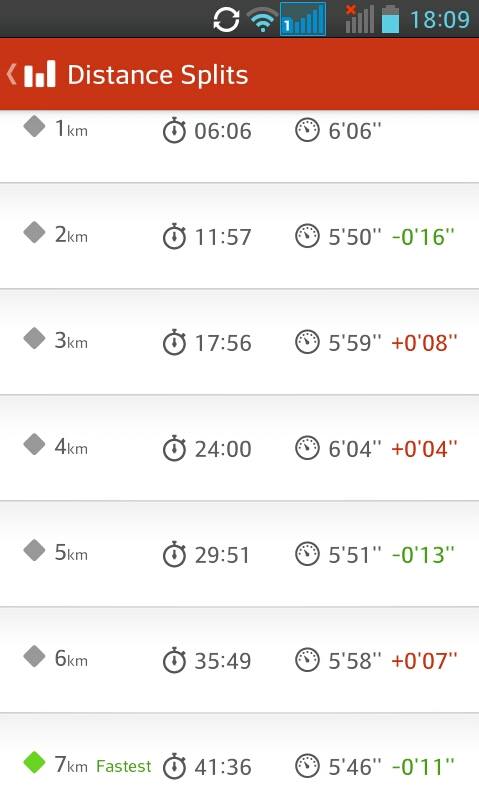
A road runner who is well trained and fit attempts to run "negative splits." Negative splits are when the runner's speed increases with distance. I attempted a seven kilometer negative split run on Wednesday evening. If I succeeded, then my speed should have increased with each kilometer. Although my speed kilometer-on-kilometer was not always faster, if the trend line is positive and the correlation is stronger than none, then overall my speed increased.
In this study the distance data are the x-values and the speed data are the y-values. Distances are in kilometers. Speeds are in centimeters per second.
Distance (km) 	Speed (cm/s)
1 	273
2 	285
3 	276
4 	277
5 	285
6 	279
7 	288

	1	What is the level of measurement for the data?
	2 	Calculate the sample size n: _
	3 	Calculate the slope of the relationship. _
	4 	Calculate the y-intercept of the relationship. Round to two decimal places. _
	5 	Use the slope and intercept to calculate the predicted speed at a distance of 2.5 kilometers. In the calculation use the unrounded slope and intercept values in the spreadsheet. Round the final answer to two decimal places. _
	6 	Use the slope and intercept to calculate the predicted distance at which the speed will be 280 centimeters per second. In the calculation use the unrounded slope and intercept from the spreadsheet functions. Round the final answer to two decimal places. _
	7 	Is the relation between the variables positive, negative, or neutral?
	8 	Calculate the correlation coefficient r for the data. Round to two decimal places. _
	9 	Is the correlation none, weak, moderate, strong, or perfect?
	10 	Determine the coefficient of determination. Round to two decimal places. _
	11 	What percent in the variation in distance "explains" the variation in speed?