
Nike+ running app
| Distance (km) |
|---|
| 22.8 |
| 4.22 |
| 6.75 |
| 5.21 |
| 6.41 |
| 7.17 |
| 6.67 |
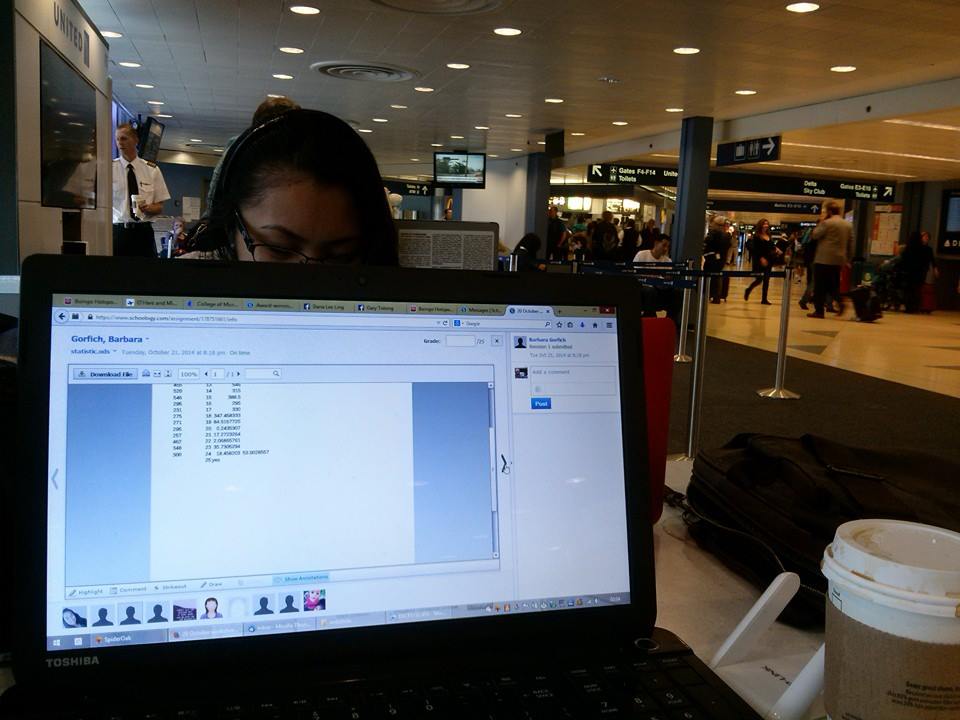
Actual quiz is in Schoology.
The first part of this quiz uses mileage from a week of running.
The data for the questions is in a web page located at the link. Copy and paste the data into a spreadsheet. For questions 1 to 14, use the mileage data . For questions 15, 16, and 17, use the airport words data
For the numeric score data
- What is the level of measurement?
- Determine the sample size n.
- Determine the minimum.
- Calculate the first quartile.
- Determine the median.
- Calculate the third quartile.
- Determine the maximum.
- Calculate the range.
- Calculate the interquartile range.
- Calculate the mode.
- Calculate the sample mean x.
- Calculate the sample standard deviation sx.
- Calculate the coeficient of variation CV.
- What is the z-score for a dance score of 53? You will need to use the mean and standard deviation you calculated for earlier questions.


| Airports |
|---|
| Honolulu |
| O'Hare |
| Asheville |
| Asheville |
| O'Hare |
| Narita |
| AB Won Pat |
| AB Won Pat |
| Narita |
| O'Hare |
| O'Hare |
| Honolulu |


For the airport words data
- Make a frequency table
- Sketch a histogram (multiple choice)
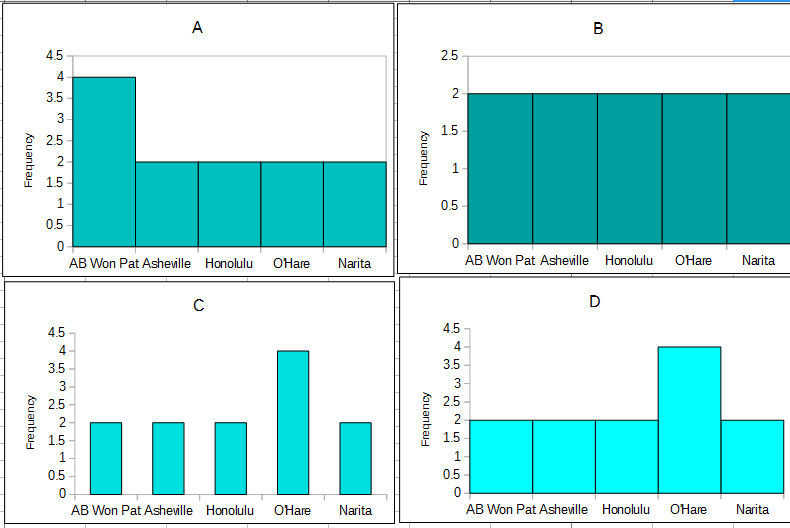
- What is the mode?
- Toughie: Which of the following is the correct box and whisker plot with outliers shown for the running distance data?
