Running mileage
When I meet other runners a commonly asked question is "How many miles do you run a week?" This is a question I have not been able to answer, I have had no way to measure and track my weekly mileage. The number of miles a runner should run is often based on the distance for which they are training. Even given those guidelines, the optimal mileage for a runner will vary with the individual. While running has health and fitness benefits, some research has suggested that there is such a thing as too much mileage. While the threshold is still not determined, the threshold is currently thought to be somewhere around or above twenty miles per week.
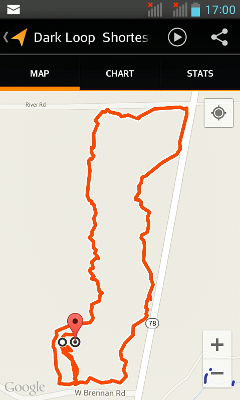
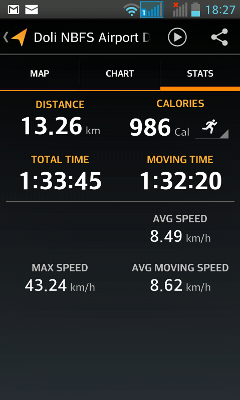
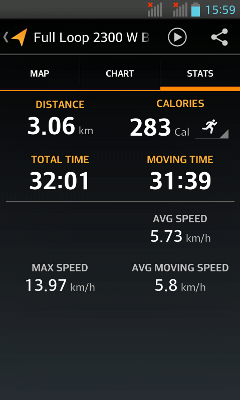
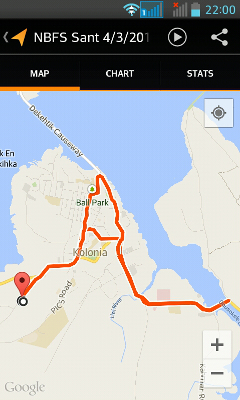
In October 2014 I acquired my first GPS equipped cell phone. Using the Google My Tracks app I could, for the first time, run, juggle, and track my distance. Using the data recorded by My Tracks, I can calculate my outdoor running mileage for the first 16 weeks of 2015.
Basic statistics for a single variable table one
Basic statistics for paired, correlated variables table two
Open data exploration and data analysis table three
I. Basic statistics for a single variable
Course student learning outcome one: Students will be able to perform basic statistical calculations for a single variable up to and including graphical analysis, confidence intervals, hypothesis testing against an expected value, and testing two samples for a difference of means.
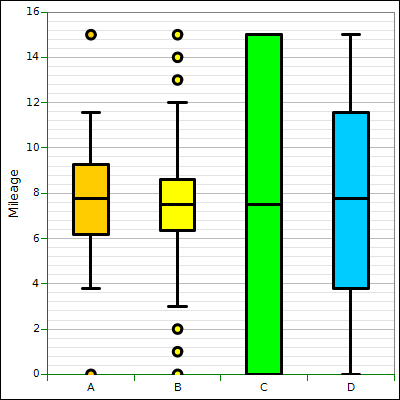
Weekly mileage for the first sixteen weeks of 2015
| Table One |
|---|
| Mileage |
|---|
| 0 |
| 12 |
| 4 |
| 2 |
| 3.1 |
| 11.2 |
| 4.5 |
| 0 |
| 15 |
| 10.4 |
| 13.9 |
| 7.2 |
| 11.4 |
| 13 |
| 8.3 |
| 6.5 |
- What level of measurement is the mileage data?
- Calculate the sample size n:_
- Calculate the minimum:_
- Calculate the first quartile Q1:_
- Calculate the median:_
- Calculate the third quartile Q3:_
- Calculate the maximum:_
- Which is the correct box and whisker plot for the data?
- Calculate the range:_
- If the data is divided into five classes, calculate the width of a single class:_
-
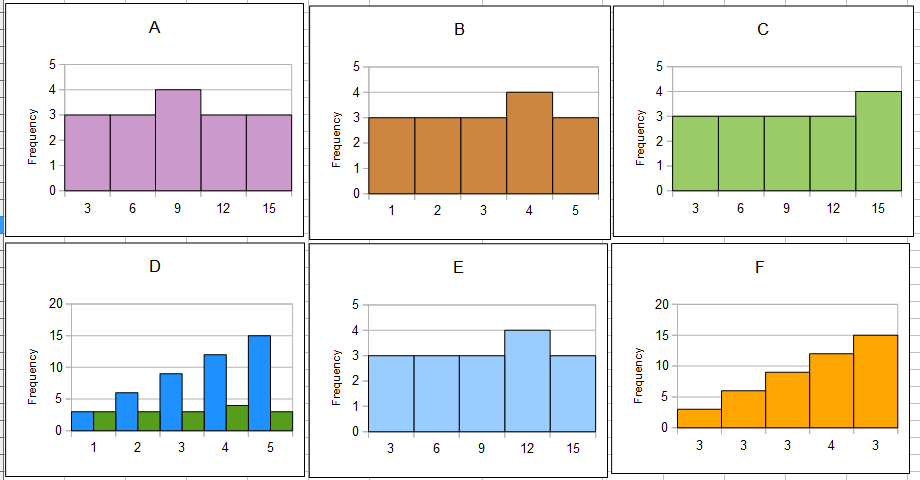
Determine the frequency and calculate the relative frequency for the data using five classes.
| Class upper limits | Frequency F | Rel. Freq. |
|---|
| | |
| | |
| | |
| | |
| | |
| Sums: | | |
Which is the correct frequency histogram?
- What is the shape of the histogram?
- Calculate the mode:_
- Calculate the mean:_
- Calculate the sample standard deviation sx:_
- Calculate the standard error SE of the sample mean:_
- Calculate the degrees of freedom:_
- Calculate t-critical for a 95% confidence level:_
- Calculate the margin of error E of the sample mean:_
- Calculate the lower bound for the 95% confidence interval for the population mean μ:_
- Calculate the upper bound for the 95% confidence interval for the population mean μ:_
II. Basic statistics for paired, correlated variables
Course student learning outcome two: Students will be able to perform basic statistical calculations for paired correlated variables.
Paired data: time in hours versus distance in miles for eighteen recent runs.
| Table Two |
|---|
| Hours | Miles |
|---|
| 0.95 | 4.5 |
| 0.94 | 5 |
| 0.77 | 4.7 |
| 1.22 | 5.4 |
| 1.33 | 5.2 |
| 2.77 | 10.5 |
| 0.84 | 3.3 |
| 1.04 | 4.9 |
| 0.43 | 2.3 |
| 1.24 | 5.8 |
| 1.24 | 5.6 |
| 0.74 | 4.1 |
| 1.28 | 6.8 |
| 0.57 | 2.6 |
| 0.48 | 2.6 |
| 0.52 | 3.2 |
| 0.56 | 2.6 |
| 0.89 | 5.1 |
- For the paired data, calculate the sample size n:_
- Calculate the slope of the linear regression for the data:_
- Calculate the y-intercept of the linear regression for the data:_
- Is the relation positive, negative, or neutral?
- Calculate the correlation coefficient r for the data:_
- Is the correlation none, weak/low, moderate, strong/high, or perfect?
- Determine the coefficient of determination:_
- Use the slope and intercept to predict the distance that I could run in two hours:_
- Use the slope and intercept to predict the time to run seven miles:_

Increased mileage?
III. Open data exploration and data analysis
Course student learning outcome three: Students will be able to engage in data exploration and analysis using appropriate statistical techniques including numeric calculations, graphical approaches, and tests.
In 2014 I was aware for the first time that my weekly mileage was low for a runner. I wanted to improve my weekly mileage in 2015. The following data compares the mileage for the last 16 weeks of 2014 to the first 16 weeks of 2015.
| Table Three |
|---|
| Weekly mileage 2014 | Weekly mileage 2015 |
|---|
| 2.9 | 0 |
| 8.8 | 12 |
| 5.2 | 4 |
| 5.7 | 2 |
| 0 | 3.1 |
| 6.9 | 11.2 |
| 3.9 | 4.5 |
| 8.5 | 0 |
| 5.1 | 15 |
| 7.8 | 10.4 |
| 3.7 | 13.9 |
| 7.4 | 7.2 |
| 8.2 | 11.4 |
| 4.1 | 13 |
| 9.2 | 8.3 |
| 7.7 | 6.5 |
Provide numeric statistical support for the answers to the following questions. Use the single blank to write up your answers to the questions including the statistical support for your answers.
- Has my weekly mileage increased from 2014 to 2015?
- Is that increase statistically significant?
Do not simply write down any and all statistics you have ever learned. Answer the questions and then cite the specific statistic, statistics, or charts that support that answer. When citing a statistic or statistics, include both the name of the statistic and the numeric value.