fx sc3 Name:
| Power kW |
|---|
| 0.0 |
| 5.4 |
| 6.1 |
| 8.0 |
| 10.5 |
| 13.7 |
| 39.8 |
| 42.3 |
| 43.4 |
| 45.2 |
| 50.7 |
| 54.0 |
| 58.8 |
| 73.2 |
| 53.1 |
| 79.1 |
| 83.3 |
| 125.8 |
| 123.1 |
| 142.5 |


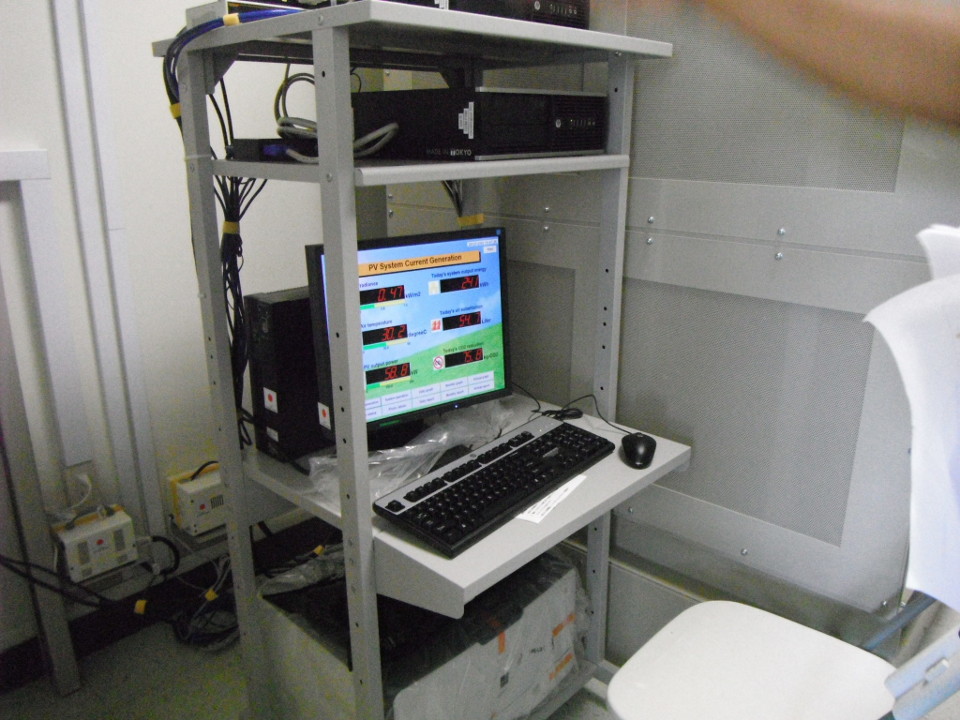
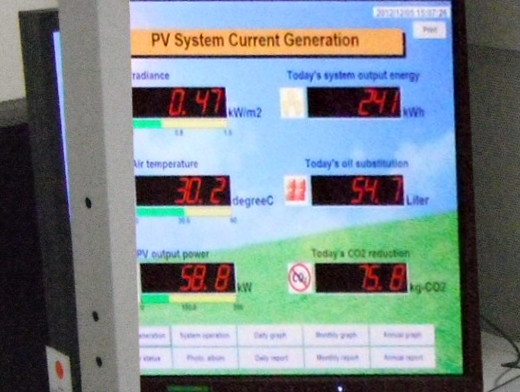
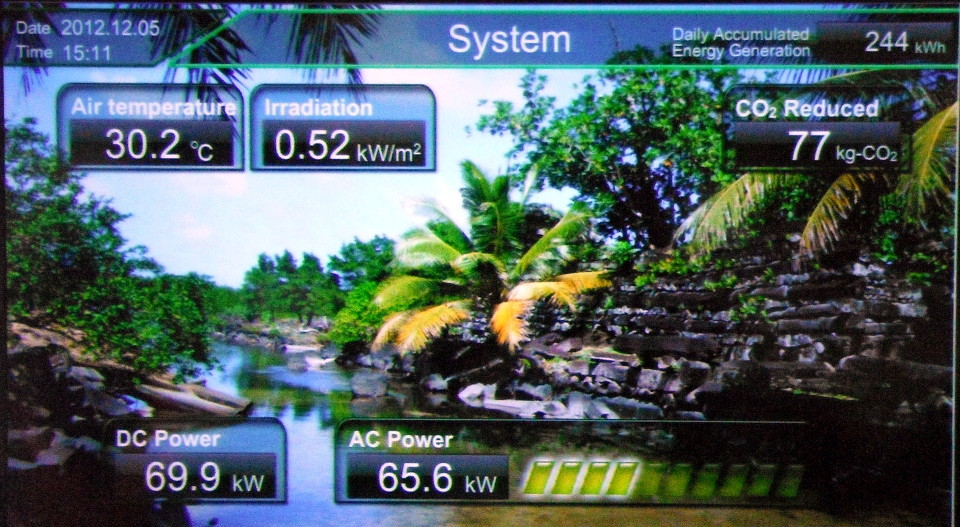
The data is a series of power output values in kilowatts for the solar array in the parking lot.
- __________ Calculate the sample size n.
- __________ Calculate the minimum (quartile 0).
- __________ Calculate the first quartile (Q1).
- __________ Calculate the median (quartile 2).
- __________ Calculate the third quartile (Q3).
- __________ Calculate the maximum (quartile 4).
- __________ Calculate the Inter-Quartile Range (IQR).
- __________ Calculate 1.5 × IQR.
- __________ Calculate Q1 − 1.5 × IQR.
- __________ Calculate Q3 + 1.5 × IQR.
- Sketch the box plot for the data.
- __________ Calculate the range.
- __________ If the data is divided into five classes,
what is the width of a single class?
-
Determine the frequency and calculate the relative frequency for the data using five classes.
Record your results in the table provided.
| Class upper limits | Frequency F | Rel. Freq. |
|---|
| | |
| | |
| | |
| | |
| | |
| Sums: | | |
- Sketch a frequency histogram for the data, labeling your horizontal axis and vertical axis as appropriate.
- __________ What is the shape of the histogram?
- __________ Calculate the mode.
- __________ Calculate the mean.
- __________ Calculate the sample standard deviation sx.
- __________ Calculate the standard error SE of the sample mean.
- __________ Calculate the degrees of freedom.
- __________ Calculate t-critical for a 95% confidence level.
- __________ Calculate the margin of error E of the sample mean.
- Calculate the 95% confidence interval for the population mean μ
p(__________ < μ < __________) = 0.95
| Irradiation (kW/m²) | Power (kW) |
|---|
| 0.02 | 0.0 |
| 0.06 | 5.4 |
| 0.09 | 6.1 |
| 0.33 | 8.0 |
| 0.38 | 10.5 |
| 0.45 | 13.7 |
| 0.53 | 39.8 |
| 0.74 | 42.3 |
| 0.96 | 131.3 |
| 1.21 | 142.5 |
- _________ For the paired data, calculate the sample size n (the number of data pairs).
- ______________ Calculate the slope of the linear regression for the data.
- ______________ Calculate the y-intercept of the linear regression for the data.
- ______________ Is the relation positive, negative, or neutral?
- ______________ Calculate the correlation coefficient r for the data.
- ______________ Is the correlation none, weak/low, moderate, strong/high, or perfect?
- ______________ Determine the coefficient of determination.
- ______________ Use the slope and intercept to predict the Power at an Irradiation of 0.85 kW/m².
- ______________ Use the slope and intercept to predict the Irradiation at a Power of 160 kW.
Data exploration
| Non-N |
|---|
| -27 |
| -99 |
| 136 |
| 93 |
| 50 |
| -28 |
| 1 |
| -56 |
| -77 |
| 123 |
| 42 |
| -26 |
| -113 |
| 154 |
| -1 |
| -23 |
| 52 |
| 72 |
| 128 |
| -141 |
| N |
|---|
| -53 |
| -101 |
| 144 |
| -47 |
| 119 |
| 162 |
| 187 |
| 181 |
| 204 |
| 136 |
| -60 |
| 62 |
| 24 |
| 210 |
| 98 |
| 205 |
| 5 |
| -33 |
| 36 |
| 93 |
The following data is based loosely on a paper by Sigrid C. Resh, Dan Binkley, and John A. Parrotta on the Greater Soil Carbon Sequestration under Nitrogen-fixing Trees Compared with Eucalyptus Species. Carbon, in chemical compounds such as carbon dioxide and methane, contributes to global warming and climate change. Plants remove carbon dioxide from the air, using the carbon to make wood, leaves, and sugar compounds. Of all plants, trees remove the most carbon from the atmosphere. Programs are being developed globally to encourage the planting of trees.
The work done by Resh, Binkley, and Parrota focused on a particular family of trees that are known to "fix nitrogen" in the soil. Resh, Binkley, and Parrota compared the amount of carbon the nitrogen (N) fixing trees contributed to the soil and compared this to non-nitrogen (Non-N) fixing trees. Nitrogen fixing trees include trees such as Falcataria moluccana (tuhke karisihn) and Adenanthera pavonina (kaikes, mwetkwem, red sandalwood). The non-nitrogen fixing trees in the study were Eucalptus trees. The rainbow gum tree of Mindanao with multi-colored bark that peels off (Eucalyptus deglupta) is an example of a Eucalptus tree.
The goal of Resh, Binkley, and Parrotta was to determine whether nitrogen fixing trees were able to store (sequestrate) more carbon in the soil than the non-nitrogen fixing trees. If true, then nitrogen fixing trees would remove more overall carbon from the atmosphere. This would reduce the green house effect and help slow down global warming.
The data is the gain or loss of soil organic carbon (SOC) in grams per meter squared per year for the soil associated with an individual tree. The greater the gain (positive values), the better for the purposes of this study. This author did not have access to the original data, the following data is based very loosely on statistical information supplied in the report.


Ethnobotany class in front of Eucalyptus deglupta on field trip, Falcataria moluccana on campus
The non-nitrogen fixing tree data (Non-N) is for twenty randomly selected rainbow gum trees located in Kamar, Nett. The nitrogen fixing tree data is for twenty randomly selected Falcataria moluccana located in Palikir, Sokehs. The trees were purely randomly selected, the data is reported in the random order that the trees were selected.
Do nitrogen fixing trees store significantly more carbon in the soil than non-nitrogen fixing trees?
Use the data to generate an appropriate statistical analysis. Include numeric support for any answers you give, write any hypotheses you develop.

