MS 150 Statistics q03 2.22 • Name:
| Speed (m/s) |
|---|
| 1.34 |
| 1.35 |
| 1.39 |
| 1.42 |
| 1.43 |
| 1.43 |
| 1.43 |
| 1.45 |
| 1.47 |
| 1.55 |
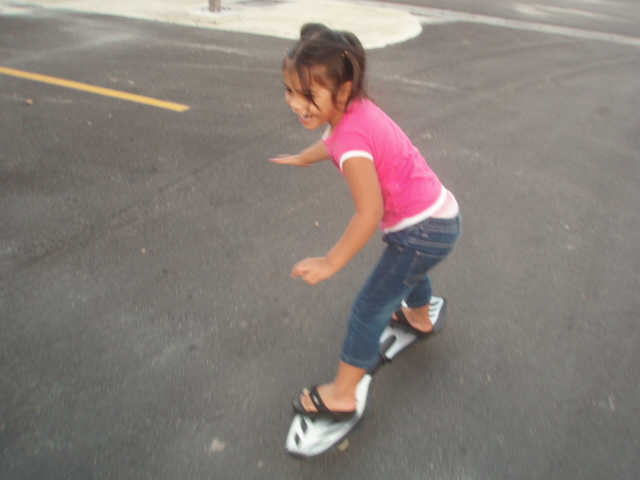
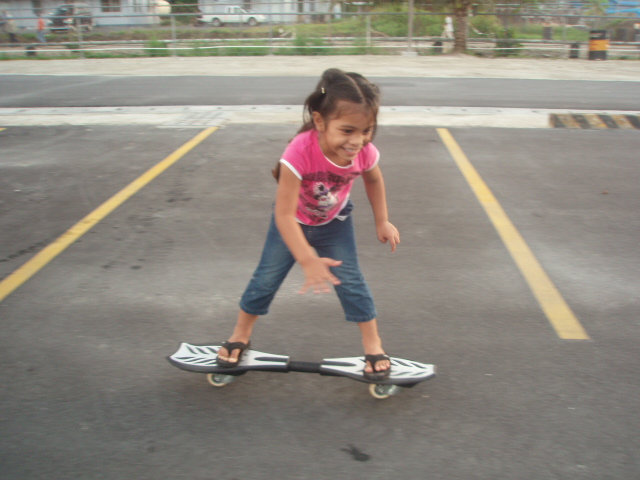
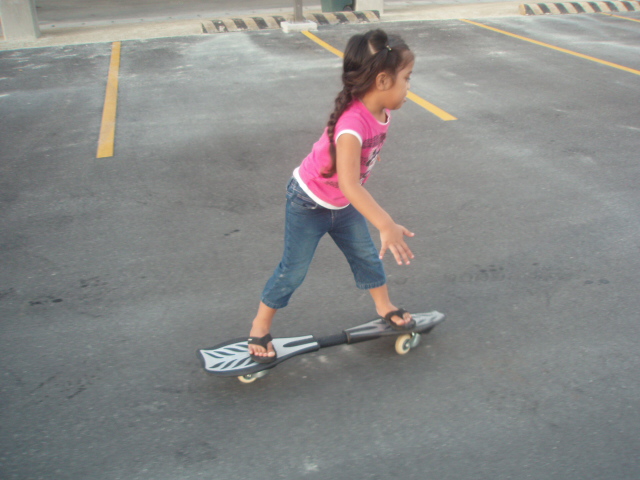
The data is ten different speeds for a RipStik rider.
- __________ What is the level of measurement for the data?
- __________ Find the sample size n.
- __________ Find the minimum.
- __________ Find the maximum.
- __________ Find the range.
- __________ If this data is divided into three classes, what is the width of a single class?
-
Determine the frequency and calculate the relative frequency using three classes.
Record your results in the table provided.
| Class upper limits | Frequency F | Relative Frequency p(x) |
|---|
| | |
| | |
| | |
| Sums: | | |
-
Sketch a frequency histogram of the data, labeling your horizontal axis and vertical axis as appropriate.
- What is the shape of the histogram?