| 12 | 1 | level | ratio | Riders | Year | Riders | ||
| 2 | sample size n | 11 | 6 | 8 | 6 | |||
| 3 | min | 6 | 7.5 | 9 | 7.5 | |||
| 4 | max | 12 | 9.1 | 10 | 9.1 | |||
| 5 | range | 6 | 9.4 | 11 | 9.4 | |||
| 6 | midrange | 9 | 9.7 | 12 | 9.7 | |||
| 7 | mode | 9.7 | 9 | 13 | 9 | |||
| 8 | median | 9.7 | 10.3 | 14 | 10.3 | |||
| 9 | mean | 9.33 | 12 | 15 | 12 | |||
| 10 | stdev | 1.54 | 9.7 | 16 | 9.7 | |||
| 11 | cv | 0.17 | 0.17 | 10.1 | 17 | 10.1 | ||
| 12 | width | 1.2 | 9.8 | 18 | 9.8 | |||
| 13 |
|
|||||||
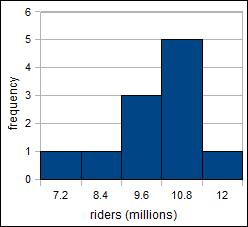
| 8 | CUL | F | RF | |||||
| 7.2 | 1 | 0.09 | ||||||
| 8.4 | 1 | 0.09 | ||||||
| 9.6 | 3 | 0.27 | ||||||
| 10.8 | 5 | 0.45 | ||||||
| 12 | 1 | 0.09 | ||||||
| 11 | 1 | |||||||
| 5 | 15 | shape | skewed left | |||||
| 16 | z for 12.2 | 1.86 | 1.86 | |||||
| 17 | infer | ordinary | ||||||
| 18 | z for 35.9 | 17.24 | 17.25 | |||||
| 19 | infer | extraordinary | ||||||
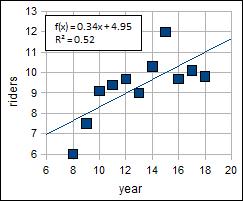
| 12 | 20 | slope | 0.34 |
|
||||
| 21 | intercept | 4.95 | ||||||
| 22 | 2010 | 11.68 | 11.75 | |||||
| 23 | 35.9 | 92 | 91.03 | |||||
| 24 | nature | linear/non-linear | ||||||
| 25 | trend | positive | ||||||
| 26 | correlation r | 0.72 | ||||||
| 27 | strength | strong | ||||||
| 28 | coef determ | 0.52 | ||||||
| 29 | percent | 52.38% | ||||||
| 30 | good business | yes | ||||||
| 31 | positive growth of 340 K riders per year that the correlation says is "reliable" | |||||||
| 37 | ||||||||