MS 150 Statistics spring 2008 mx • Name:
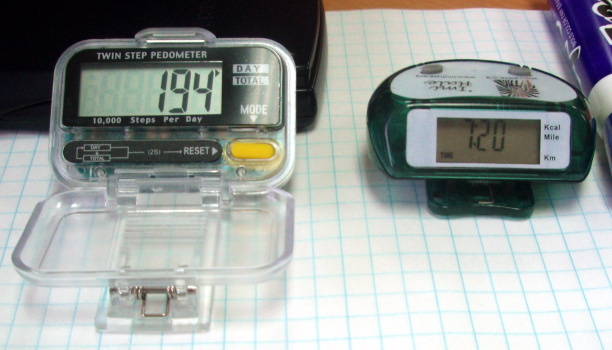
Pedometer
| Day | Steps |
|---|
| Sun | 3611 |
| Mon | 10477 |
| Tue | 7343 |
| Wed | 8399 |
| Thu | 15880 |
| Fri | 6943 |
| Sat | 1080 |
| Sun | 1518 |
| Mon | 11102 |
| Tue | 3687 |
| Wed | 9443 |
| Thu | 9038 |
| Fri | 3966 |
| Sat | 6500 |
Part I: Basic statistics, frequencies, histogram, z-scores, normal distribution.
The pedometer data in the table was gathered by the instructor between 20 January and 02 February 2008
- __________ What level of measurement is the data?
- __________ Find the sample size n for the data.
- __________ Find the minimum.
- __________ Find the maximum.
- __________ Find the range.
- __________ Find the median.
- __________ Find the mode.
- __________ Find the sample mean x.
- __________ Find the sample standard deviation sx.
- __________ Find the sample coefficient of variation CV.
- __________ If this data were to be divided into five bins, what would be the width of a single bin?
- Determine the frequency and calculate the relative frequency using five bins. Record your results in the table provided.
| Temperature bins (x) | Frequency (f) | Rel. Freq. p(x) |
|---|
| | |
| | |
| | |
| | |
| | |
| Sum: |
| |
- Sketch a histogram chart of the data anywhere it fits, labeling your horizontal axis and vertical axis as appropriate.
- ____________________ What is the shape of the distribution?
- p(x < 4040) = ____________________ What is the probability I will walk 4040 steps or less per day?
- p(x > 9960) = ____________________ The goal of the 10000 step program is to walk 10000 steps per day. What is the probability that I will walk greater than 9960 steps or more per day?
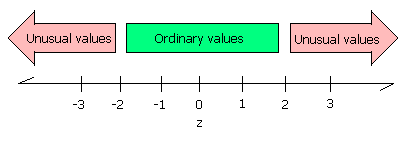
- ____________________ Use the sample mean x and standard deviation sx calculated above to determine the z-score for a day with 10000 steps
- ____________________ Is the z-score for a 10000 step day an ordinary or unusual z-score?
Part II: Linear regression
| Imi Hale | WHO |
|---|
| 0 | 0 |
| 200 | 62 |
| 278 | 194 |
| 319 | 164 |
| 655 | 396 |
Pohnpei public health has been handing out pedometers provided by the Pacific Diabetes Education Program through a grant from Imi Hale. The FSM Department of Health has recently received pedometers from WHO. The WHO pedometers use a different mechanism and algorithm than the Imi Hale pedometers. Trials in which both pedometers were worn at the same time provided the data in the accompanying table.
- __________ Does the relationship appear to be linear, non-linear, or random?
- __________ Calculate the slope of the linear regression line for the data.
- __________ Calculate the y-intercept of the linear regression for the data.
- __________ Is the correlation positive, negative, or neutral?
- __________ Determine the correlation coefficient r.
- __________ What is the strength of the correlation?
- __________ Determine the coefficient of determination r² .
- __________ If the Imi Hale pedometer has recorded 450 steps, what is the predicted WHO pedometer step count?
- __________ If the WHO pedometer has recorded 250 steps, what is the predicted Imi Hale pedometer step count?
Table of basic statistical functions used by OpenOffice
| Statistic or Parameter | Symbol | Equations | OpenOffice |
|---|
| Square root | √ | | =SQRT(number) |
| Sample size | n | | =COUNT(data) |
| Minimum | | | =MIN(data) |
| Maximum | | | =MAX(data) |
| Median | | | =MEDIAN(data) |
| Mode | | | =MODE(data) |
| Sample mean | x |
Σx/n | =AVERAGE(data) |
| Sample standard deviation | sx | | =STDEV(data) |
| Sample Coefficient of Variation | CV | sx/
x |
=STDEV(data)/AVERAGE(data) |
| Calculate a z value from an x | z | =
 |
=STANDARDIZE(x;x;sx) |