MS 150 Statistics q06 • Name:

1. The figure below depicts six curves. Which, if any, of the curves in the figure below look(s) like a normal curve? If the curve is a NOT normal curve, tell why.

Six curves

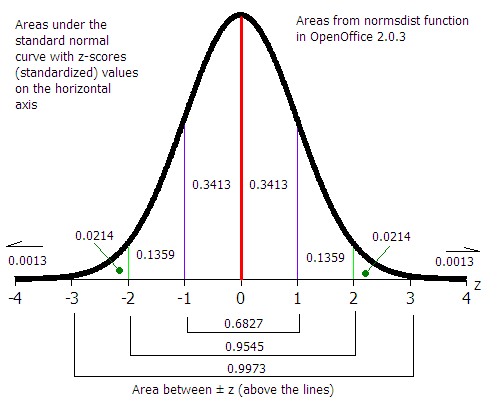
Last spring the college administered a reading comprehension test to students in English classes here at the college. The mean reading grade level for the students here at the national campus across all English courses was found to be μ = 6.5 That is the reading level at about midyear in sixth grade for a student in a stateside school. The standard deviation was σ = 2.5 Presume that this data is normally distributed for the following questions.

  1. __________ Shanarahndahnaleen tested at a grade level of 12th grade (grade 12), a senior in high school. Calculate the z-score for Shanarahndahnaleen.
  2. __________ Is her reading grade level score ordinary or unusual based on the z-score?
  3. __________ What percent of the students scored above a reading grade level of 6.5?
  4. __________ What percent of the students are reading at a level above grade 9?
  5. __________ What percent of the students read at level between grade 4 and grade 9?
  6. __________ 175 students were tested. How many of the 175 read at a level between grade 4 and grade 9?

Formula to calculate a z value from an x value: standardize
OpenOffice.org Calc formula:
=STANDARDIZE(x;μ;σ)
zscores (3K)
normal_plusminus4 (14K)