Z-Scores: A note done for admissions board
Z-scores are a useful way to combine scores
from data that has different means, ranges, and standard deviations.
The past two years z-scores have been used to help rank order the
entrance test results, yet they probably remain a mystery to most
members of the admissions board. Z-scores may yet again be found useful
when trying to combine different scores, and the ability to explain to
non-admission board members the meaning of a z-score may be useful to
admissions board members.
A brief review of measures of center
The mode is the most frequently
occurring value in a set of data.
The median is the middle value in a set of data ordered from
smallest to largest value (or largest to smallest value). If the middle
is between two values, the difference is split.
The mean is the result of adding all of the values in the data
set and then dividing by the number of values in the data set. The word
mean and average are interchangeably used in statistics.
mean = (sum of the data)÷ (count or sample size of the data)
Measures of spread
The range is the largest value minus
the smallest value in a data set
The standard deviation can be thought of as a mathematical
calculation of the average distance of the data from the mean of the
data. Note that although I use the words average and mean, the sentence
could also be written "the mean distance of the data from the mean of
the data."
Rules of thumb regarding spread
At least 75% of the data will be within two
standard deviations of the mean.
At least 89% of the data will be within three standard deviations of
the mean.
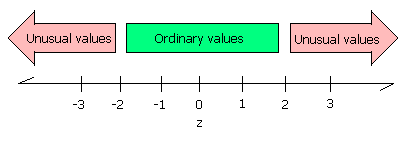
Data beyond two standard deviations away from the mean is considered
"unusual" data.
Z-Scores
Z-scores simply indicate how many standard
deviations away from the mean is a particular score. This is termed
"relative standing" as it is a measure of where in the data the score
is relative to the mean and "standardized" by the standard deviation.
The formula for z is:
z = (x - mean) ÷ standardDeviation
Note the parentheses!
Data that is two standard deviations below the mean will have a z-score
of -2, data that is two standard deviations above the mean will have a
z-score of +2. Data beyond two standard deviations away from the mean
will have z-scores beyond -2 or 2.

Why z-scores?
Suppose subtest one has a mean score of 10
and a standard deviation of 2 with a total possible of 20. On this test
a score of 18 would be an unusually high score. Suppose subtest two has
a mean of 100 and standard deviation of 40 with a total possible of
200. On subtest two a score of 140 would be high, but not unusually
high.
Adding the scores and saying the student had a score of 158 out of 220
devalues what is a phenomenal performance on subtest one, the score is
dwarfed by the total possible on test two. Put another way, the 18
points of test one are contributing only 11% of the 158 score. The
other 89% is the subtest two score. We are giving an eight-fold greater
weight to subtest two. The z-scores of 4 and 1 would add to five, for
an average z-score of 2.5. This gives equal weight to each subtest and
the resulting average reflects the strong performance on subtest one
with an equal weight to the ordinary performance on subtest two.
Z-scores are referred to as "relative standing" because if,
year-to-year, all schools do better on the entrance test, then the mean
rises and like a tide "lifts all the boats equally." Thus an
individual school might do better, but because the mean rose, their
z-score might remain the same. This is also the downside to using z-scores to
compare performances between tests - changes in "sea level" are obscured, but knowing whether the overall
mean and standard deviation changed helps to properly interpret a
z-score.
The complication
Z-scores are based on the mean of the data
and the standard deviation of the data. If more data is added to the
data set, both the mean and standard deviation will change. Thus a
student's z-score changes as other data is entered after that student.
In an improvement over the work I did two years ago, last year the
z-scores were used to assist in producing a rank order of the
students. The rank order was then used along with pilot test data to
set test-by-test cutoffs. The cut-offs were then crafted into a formula
that could be applied to any subsequent test. As had been found the
year before, students below three standard deviations in an average
combined z-score were found to have performed indistinguishably from
random on the subtests.
