| x: cars/5 min |
|---|
| 7 |
| 2 |
| 12 |
| 5 |
| 19 |
| 7 |
| 13 |
| 7 |
| 4 |
| 6 |
| 16 |
| 10 |
The data is the number of cars per five minute period passing past Song Mahs, Pehleng, Kitti over the course of an hour from 17:08 to 18:08 on Monday evening, 30 October 2006.
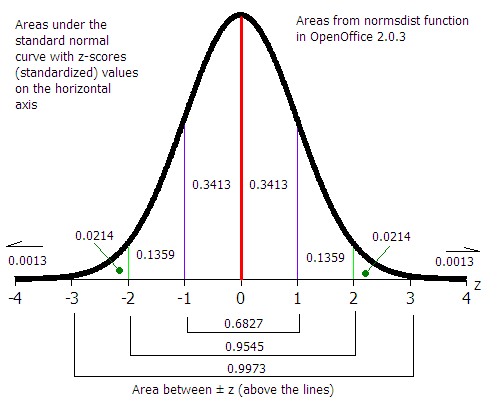
Presume that the number of cars per five minute period distribution data comes from a normal distribution. The following problems derive from chapter seven. Use the standard normal distribution to determine your answers. Use the sample mean x from question one for µ, and the sample standard deviation sx from question two for σ in the questions below. Use a spreadsheet to calculate z values and probabilities as appropriate. Here the variable is x and NOT x.
Use the sample mean x from question one and the sample standard deviation sx from question two and the data given in the first table to calculate a 95% confidence interval for the population mean µ number of cars per five minute periods using the student's t-distribution.
| Statistic or Parameter | Symbol | Equations | Excel |
|---|---|---|---|
| Chapter seven: Normal statistics | |||
| Calculate a z value from an x | z | = |
=STANDARDIZE(x; µ;σ) |
| Calculate an x value from a z | x | = z σ + µ | =z*σ+µ |
| Find a probability p from a z value | =NORMSDIST(z) | ||
| Find a z value from a probability p | =NORMSINV(p) | Chapter eight: Distribution of the sample mean x | |
| Calculate a z-statistic from an x | z |  |
=(x - µ)/(sx/SQRT(n)) |
| Calculate a t-statistic (t-stat) | t |  |
=(x - µ)/(sx/SQRT(n)) |
| Calculate an x from a z | =µ + zc*sx/sqrt(n) | ||
| Chapter nine: Confidence interval statistics | |||
| Degrees of freedom | df | = n-1 | =COUNT(data)-1 |
| Find a tc value from a confidence level c and sample size n | tc | =TINV(1-c;n-1) | |
| Calculate an error tolerance E of a mean for any n ≥ 5 using sx. | E | =tc*sx/SQRT(n) | |
| Calculate a confidence interval for a population mean µ from the sample mean x and error tolerance E: | x-E ≤ µ ≤ x+E | ||
Calendar • Statistics • Lee Ling • COMFSM