| Term |
Enrollment |
|
|
|
|
| Fall 98 |
692 |
|
|
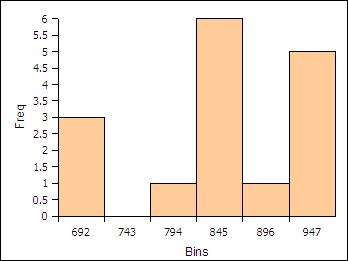
11.Six bins |
|
| Spring 99 |
641 |
|
Bins |
Frequency |
Relative Frequency |
| Fall 99 |
799 |
|
692 |
3 |
0.19 |
| Spring 00 |
684 |
|
743 |
0 |
0 |
| Fall 00 |
858 |
|
794 |
1 |
0.06 |
| Spring 01 |
746 |
|
845 |
6 |
0.38 |
| Fall 01 |
941 |
|
896 |
1 |
0.06 |
| Spring 02 |
795 |
|
947 |
5 |
0.31 |
| Fall 02 |
946 |
|
Sums: |
16 |
1 |
| Spring 03 |
837 |
|
|
|
|
| Fall 03 |
947 |
|
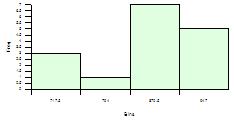
11. Four bins (wordo uncaught in 9:00 section) |
|
|
| Spring 04 |
842 |
|
Bins |
Frequency |
RF |
| Fall 04 |
914 |
|
717.5 |
3 |
0.19 |
| Spring 05 |
801 |
|
794 |
1 |
0.06 |
| Fall 05 |
899 |
|
870.5 |
7 |
0.44 |
| Spring 06 |
796 |
|
947 |
5 |
0.31 |
| 16 |
1. Find the sample size n. |
|
Sums: |
16 |
1 |
| 641 |
2. Find the minimum enrollment. |
|
| 947 |
3. Find the maximum enrollment. |
| 306 |
4. Find the range enrollment. |
| 819 |
5. Find the median enrollment. |
| No mode |
6. Find the mode. |
| 821.125 |
7. Find the sample mean x enrollment. |
| 96.03 |
8. Find the sample standard deviation sx of the enrollment. |
| 0.12 |
9. Find the sample coefficient of variation CV. |
| 51 |
10. If this data is to be divided into six bins, what is the width of a single bin? |
| trimodal or skew |
13. What is the shape of the histogram? |
|
|
|
|
|
|
|
|
|
|
|
|
|
|
|
|
|
|