 Color can be described in many different ways.
There are color words such as red, orange, yellow, green, and blue.
In optical physics each color is described by a wavelength and frequency of light.
Color can be described in many different ways.
There are color words such as red, orange, yellow, green, and blue.
In optical physics each color is described by a wavelength and frequency of light.
| Hue name | Hue angle° |
|---|---|
| red | 9 |
| orange-red | 17 |
| red-orange | 24 |
| red-orange | 24 |
| dark orange | 26 |
| orange | 30 |
| yellow-orange | 36 |
| orange-yellow | 43 |
| goldenrod | 48 |
| gold | 52 |
| yellow | 64 |
| green-yellow | 77 |
| chartreuse | 88 |
| green | 111 |
| mint | 137 |
| aquamarine | 165 |
| cyan | 184 |
| deep sky blue | 200 |
| royal blue | 217 |
| blue | 230 |
| blue | 236 |
| blue | 239 |
| indigo | 250 |
| purple | 270 |
| magenta | 303 |
Color can be described in many different ways.
There are color words such as red, orange, yellow, green, and blue.
In optical physics each color is described by a wavelength and frequency of light.
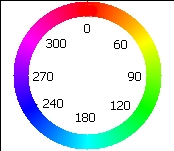
A third way to describe color is by using a color wheel or circle. The word hue is used for the word color when working with a color wheel. On a color wheel the colors are arranged in a circle in the same order that the colors appear in a rainbow. While in art class one learns that the primary colors for paint are red, yellow, and blue; the primary colors for light are different. The primary colors of light are red, green, and blue.
Red, the first color in the rainbow, is placed at the top and is assigned a color angle (or hue angle) of 0°. Once around a circle is 360°. Green is placed one third of the way around the circle at 120°. Blue is placed two-thirds of the way around the circle at 240°.
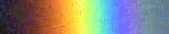
In the first section the image of a rainbow was analyzed from red to purple, with the hue angles being recorded at equal distances across the face of the rainbow.
For the hue angle data given in the table:
| Bins | Frequency | Relative Frequency f/n |
|---|---|---|
| _________ | _________ | _________ |
| _________ | _________ | _________ |
| _________ | _________ | _________ |
| _________ | _________ | _________ |
| _________ | _________ | _________ |
| _________ | _________ | _________ |
| Sums: | _________ | _________ |