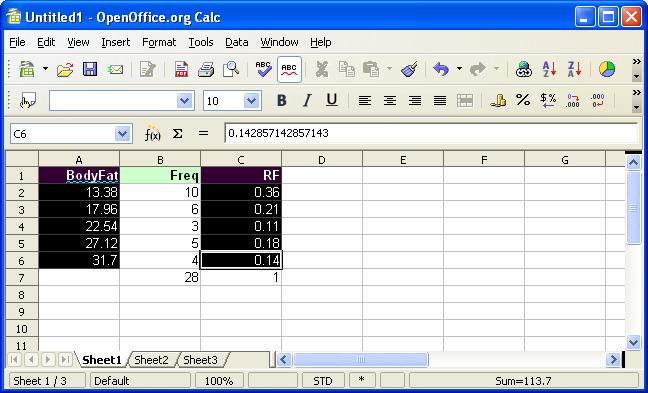
Select both the bins and frequency or relative frequency column. Use the control (Ctrl) to make the split selection required for a relative frequency histogram. To do this, select the bins. Then hold down the control key and select the relative frequency (RF) column.
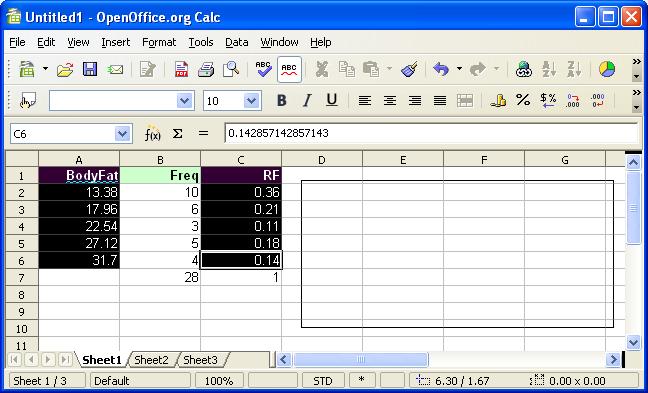
Click on the chart wizard and drag the mouse to select the size and location of the chart:
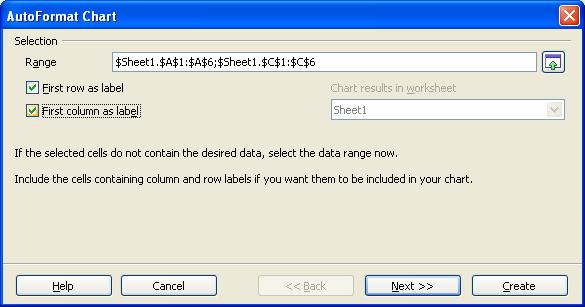
The chart wizard will appear.
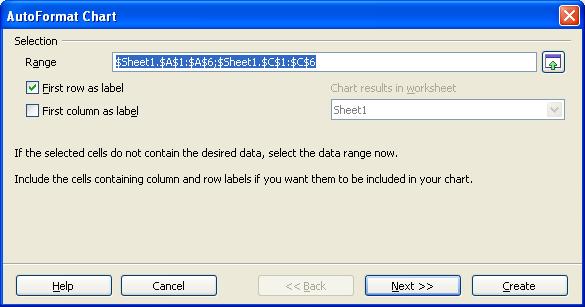
If you selected the label row as seen further above, then leave the first row as label checked. Click on the First column as label. This will use the bins as x-axis labels:
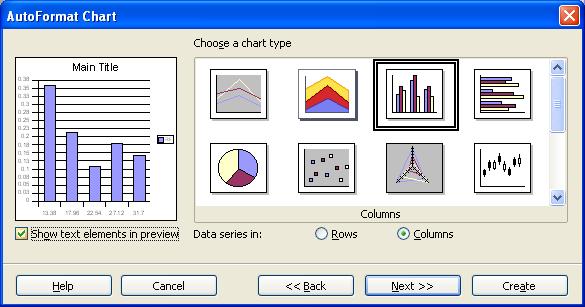
Click next. To see the text elements, click on the text elements check box.
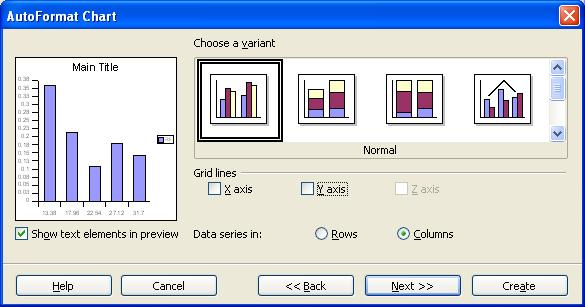
Click on next. Set options if desired.
Click on next. Set desired options.
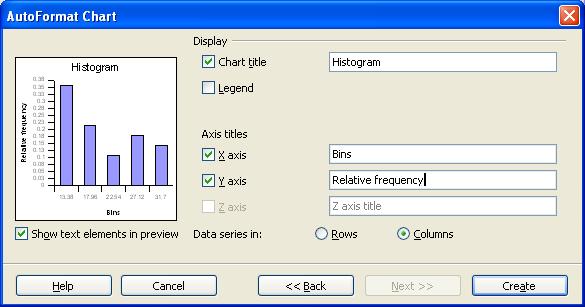
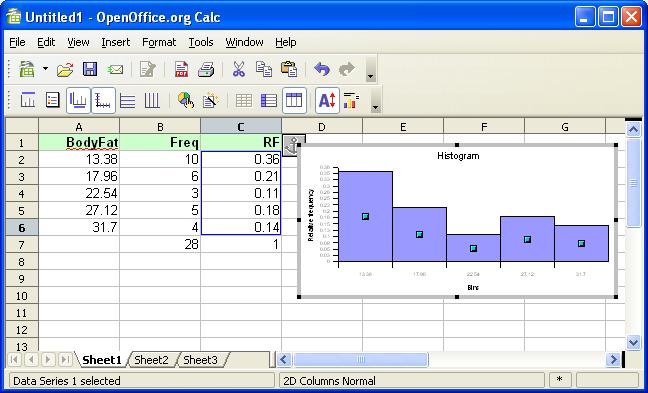
Click on Create, then double click the columns to...
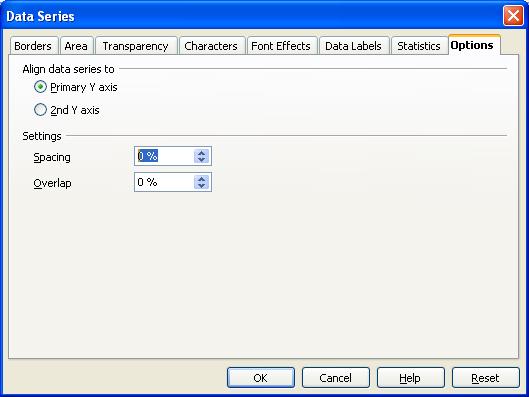
... set the spacing to zero.
Click OK.