MS 150 Statistics fall 2006 Mx • Name:
Rainfall data in this midterm derives from the
Pacific El Niño-Southern Oscillation Update, and the Western Regional Climate Center. See also Development of Annual Rainfall Distribution Map for Island of Pohnpei and Refining the R-Factor for the island of Pohnpei.
Part I: Chart
Monthly mean total precipitation (rainfall) in centimeters based on data from 1/1/1953 to 12/31/2005.
 on Pohnpei")
- _______________ What type of chart is depicted above?
- _______________ In what month does the maximum mean total rainfall occur?
Pohnpei WSO
| Month | Rain/cm |
|---|
| Jun 2005 | 40 |
| Jul 2005 | 36 |
| Aug 2005 | 28 |
| Sep 2005 | 52 |
| Oct 2005 | 31 |
| Nov 2005 | 35 |
| Dec 2005 | 38 |
| Jan 2006 | 23 |
| Feb 2006 | 23 |
| Mar 2006 | 20 |
| Apr 2006 | 36 |
| May 2006 | 45 |
| Jun 2006 | 42 |
Part II: Basic statistics, frequencies, histogram, and z-scores.
The following section is based on monthly rainfall data for the twelve months from July 2005 to June 2006 provided in the table on the right.
- __________ What level of measurement is the monthly rainfall data?
- __________ Find the sample size n for the rainfall data.
- __________ Find the minimum monthly rainfall.
- __________ Find the maximum monthly rainfall.
- __________ Find the range of the monthly rainfall.
- __________ Find the median monthly rainfall.
- __________ Find the mode for the monthly rainfall.
- __________ Find the sample mean x monthly rainfall.
- __________ Find the sample standard deviation sx for the monthly rainfall.
- __________ Find the sample coefficient of variation CV.
- __________ If this data were to be divided into five bins, what would be the width of a single bin?
- Determine the frequency and calculate the relative frequency using five bins. Record your results in the table provided.
Frequency table
| Bins (x) | Frequency (f) | Rel. Freq. p(x) |
|---|
| _______ | _______ | _______ |
| _______ | _______ | _______ |
| _______ | _______ | _______ |
| _______ | _______ | _______ |
| _______ | _______ | _______ |
| Sum: |
_______ | _______ |
- Sketch a relative frequency histogram chart of the data here or on the back, labeling your horizontal axis and vertical axis as appropriate.
- ____________________ What is the shape of the distribution?
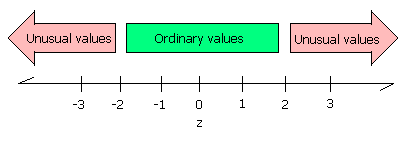
- ____________________ As measured at the weather service office in Kolonia, Pohnpei has a mean monthly rainfall of µ of 40 centimeters of rain with a standard deviation σ of 6. In April of this year 72 centimeters of rain fell on Nahna Laud. What is the z-score for the rainfall on Nahna Laud?
- ____________________ Was the April rainfall on Nahna Laud ordinary or extraordinary?
Part III: Linear regression
25 September 2006:
NASA Study Finds World Warmth Edging Ancient Levels. A new study by NASA scientists finds that the world's temperature is reaching a level that has not been seen in thousands of years. The study concludes that, because of a rapid warming trend over the past 30 years, the Earth is now reaching and passing through the warmest levels in the current interglacial period, which has lasted nearly 12,000 years. Recent warming is forcing species of plants and animals to move toward the north and south poles. The global warming is not evenly distributed, and the western Pacific ocean is warming while the eastern Pacific ocean has not warmed. This is expected to cause more frequent and stronger El Niño events such as those Pohnpei experienced in 1983 and 1998. An unexpected and unpredicted El Niño now appears to be
developing.
Temperature anomalies
| Year (x) | Temp anomaly/°C (y) |
|---|
| 1880 | 0.00 |
| 1900 | 0.05 |
| 1920 | 0.10 |
| 1940 | 0.20 |
| 1960 | 0.30 |
| 1980 | 0.50 |
| 2000 | 0.75 |
- __________ Calculate the slope of the linear trend line for the data. Keep at least three significant (non-zero) digits. Use Format:Cells:Numbers to increase the number of decimal places displayed.
- __________ Calculate the y-intercept for the data.
- __________ Is the correlation positive, negative, or neutral?
- __________ Determine the correlation coefficient r.
- __________ Is the correlation none, low, moderate, high, or perfect?
- __________ Does the relationship appear to be linear or non-linear?
- __________ Determine the coefficient of determination.
- __________ What percent in the variation in the years accounts for the variation in the temperature anomaly?
- __________ What will the temperature anomaly be in 2020?
- __________ When the temperature anomaly reaches 1.75 °C the planet Earth will be the warmest in the past million years. Using the slope and intercept above, calculate the year in which the temperature anomaly will be 1.75 °C.
Table of statistical functions used by OpenOffice
| Statistic or Parameter |
Symbol |
Equations |
OpenOffice |
| Square root |
|
|
=SQRT(number) |
| Sample mean |
x |
Σx/n |
=AVERAGE(data) |
| Sample standard deviation |
sx |
|
=STDEV(data) |
| Sample Coefficient of Variation |
CV |
sx/x |
=STDEV(data)/AVERAGE(data) |
| Calculate a z value from an x |
z |
=
 |
=STANDARDIZE(x;µ;σ) |
| Slope |
b |
|
=SLOPE(y data;x data) |
| Intercept |
a |
|
=INTERCEPT(y data;x data) |
| Correlation |
r |
|
=CORREL(y data;x data) |
| Coefficient of Determination |
r² |
|
=(CORREL(y data;x data))^2 |
Statistics •
Lee Ling •
COM-FSM