| Name | Essay score x/40 |
|---|---|
| Saturnina | 30 |
| Jehosephat | 35 |
| Theophillia | 32 |
| Cuteleen | 29 |
| Fashionette | 36 |
| Jamesbond | 19 |
| Santa | 20 |
| Rambo | 29 |
The data is eight actual student essay scores from PICS high school, the names are fictitious.
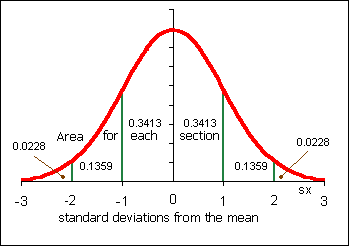
Presume that the essay scores were normally distributed. The following problems derive from chapter seven. Use the standard normal distribution to determine your answers. Use the sample mean x from question one for µ, and the sample standard deviation sx from question two for σ in the questions below. Use Excel to calculate z values and probabilities as appropriate. Here the variable is x and NOT x.
Use the sample mean x from question one and the sample standard deviation sx from question two and the data given in the first table to calculate a 95% confidence interval for the population mean µ essay score using the student's t-distribution.
| d.f. | tc |
|---|---|
| 4 | 2.7764 |
| 5 | 2.5706 |
| 6 | 2.4469 |
| 7 | 2.3646 |
| 8 | 2.3060 |
| 9 | 2.2622 |
| 10 | 2.2281 |
| zc | 1.9600 |
| Statistic or Parameter | Symbol | Equations | Excel |
|---|---|---|---|
| Chapter seven: Normal statistics | |||
| Calculate a z value from an x | z | = |
=STANDARDIZE(x, µ, σ) |
| Calculate an x value from a z | x | = z σ + µ | =z*σ+µ |
| Find a probability p from a z value | =NORMSDIST(z) | ||
| Find a z value from a probability p | =NORMSINV(p) | Chapter eight: Distribution of the sample mean x | |
| Calculate a z-statistic from an x | z |  |
=(x - µ)/(sx/SQRT(n)) |
| Calculate a t-statistic (t-stat) | t |  |
=(x - µ)/(sx/SQRT(n)) |
| Calculate an x from a z | =µ + zc*sx/sqrt(n) | ||
| Chapter nine: Confidence interval statistics | |||
| Find a tc value from a confidence level c and sample size n | tc | =TINV(1-c,n-1) | |
| Calculate an error tolerance E of a mean for any n ≥ 5 using sx. | E | =tc*sx/SQRT(n) | |
| Calculate a confidence interval for a population mean µ from a sample mean x and an error tolerance E | x-E≤ µ ≤x+E | ||