| Name | Duration/minutes |
|---|---|
| Daniel S. | 43 |
| Elvis | 57 |
| Lee Ling | 73 |
| Israel | 79 |
| Aloka | 79 |
| Paul | 86 |
| Joshua | 94 |
| Branson | 98 |
| Tosiwo | 98 |
| LJ | 101 |
| Jake | 105 |
| Penina | 105 |
| Charles | 111 |
| Emmanuel | 111 |
| Edwin | 113 |
| Ermine | 115 |
| Dalina | 117 |
| Daniel M. | 118 |
Use the data in the table shown to calculate the following values.
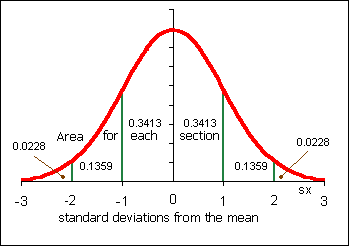
Presume that the arrival times of the walkers and runners were normally distributed. The following problems derive from chapter seven. Use the standard normal distribution to determine your answers. Use the sample mean x from question one for µ, and the sample standard deviation sx from question two for σ in the questions below. Here the variable is x and NOT x.
Use the sample mean x from question one and the sample standard deviation sx from question two and the data given in the first table to calculate a 95% confidence interval for the population mean µ duration in minutes using the student's t-distribution.
For fun if you finish early: Lee Ling jogged and juggled the 10.329 kilometers from the college to spanish wall. Measurements done at the PICS track found that during a 2.73 minute lap, Lee Ling makes 69.5 cycles of the balls where one cycle is the return of the number one ball to the right hand. With three balls, the number of tosses per hand per 2.73 minutes is thrice 69.5 or 208.5 tosses per hand each and every 2.73 minutes. Use these numbers and his time of 73 minutes to estimate the number of tosses per hand from the college to spanish wall. _______________________
| Statistic or Parameter | Symbol | Equations | Excel |
|---|---|---|---|
| Chapter seven: Normal statistics | |||
| Calculate a z value from an x | z | = |
=STANDARDIZE(x, µ, σ) |
| Calculate an x value from a z | x | = z σ + µ | =z*σ+µ |
| Find a probability p from a z value | =NORMSDIST(z) | ||
| Find a z value from a probability p | =NORMSINV(p) | Chapter eight: Distribution of the sample mean x | |
| Calculate a z-statistic from an x | z |  |
=(x - µ)/(sx/SQRT(n)) |
| Calculate a t-statistic (t-stat) | t |  |
=(x - µ)/(sx/SQRT(n)) |
| Calculate an x from a z | =µ + zc*sx/sqrt(n) | ||
| Chapter nine: Confidence interval statistics | |||
| Find a tc value from a confidence level c and sample size n | tc | =TINV(1-c,n-1) | |
| Calculate an error tolerance E of a mean for any n ≥ 5 using sx. | E | =tc*sx/SQRT(n) | |
| Calculate a confidence interval for a population mean µ from a sample mean x and an error tolerance E | x-E≤ µ ≤x+E | ||