| 1 | Mean µ | StDev σ | |||
| A | -10 | 5 | |||
| B | 0 | 10 | |||
| C | 10 | 15 | |||
| 2a | 2b | 2c | |||
| µ | 3.874 | 3.874 | 3.874 | ||
| σ | 2.938 | 2.938 | 2.938 | ||
| x | 3.874 | 0.936 | 0.000 | ||
| z | 0.000 | -1.000 | -1.319 | ||
| p | 0.500 | 0.159 | 0.094 | ||
| 2d | |||||
| right area | 0.200 | ||||
| left area | 0.800 | ||||
| z | 0.841 | ||||
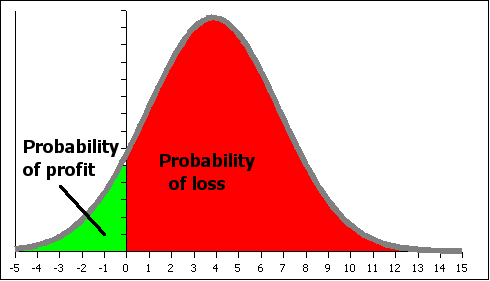
| x | 6.346 |
Question 2c diagram. The probability for profit is the green area on the left below