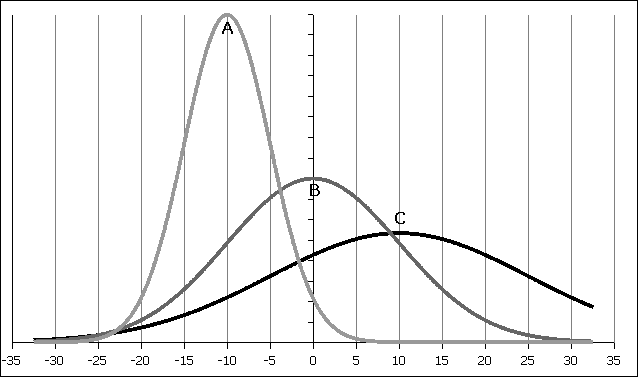
1. For the following curves A, B, and C determine the mean µ and the standard deviation
σ:
| Curve | Mean µ | standard deviation σ |
|---|---|---|
| A | -10 | 5 |
| B | 0 | 10 |
| C | 10 | 15 to 20 |
| Dist/meters |
|---|
| 441 |
| 433 |
| 433 |
| 434 |
| 436 |
| 437 |
| 441 |
| 436 |
| 444 |
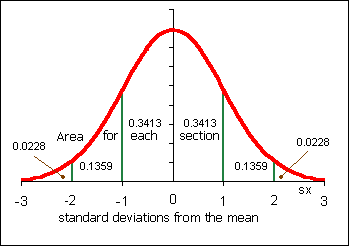
2. Using global positioning satellite systems, the length of lane four at the Pohnpei state track facility was measured nine times. Use the data in the table to determine the sample mean x and the sample standard deviation sx. Use this data to calculate a 95% confidence interval for the population mean lane four length.
| Confidence interval statistics | |||
|---|---|---|---|
| Find a tc value from a confidence level c and sample size n | tc | =TINV(1-c,n-1) | |
| Calculate an error tolerance E of a mean for any n ≥ 5 using sx. | E | =tc*sx/SQRT(n) | |
| Calculate a confidence interval for a population mean µ from a sample mean x and an error tolerance E | x-E≤ µ ≤x+E | ||