Part One: Counts of butterfly fish • Name:
| fish/25m |
|---|
| 0 |
| 3 |
| 0 |
| 10 |
| 4 |
| 3 |
| 3 |
| 0 |
| 3 |
| 1 |
| 3 |
| 10 |
| 1 |
| 8 |
| 8 |
| 10 |
| 8 |
| 15 |
| 20 |
| 5 |
Katrina Adams at Kosrae Village Resort gathered the data for this section. The numbers are the counts of butterfly fish per 25 meters along transect lines at Molsron Malem EMB#8 from five surveys conducted between 2001 and 2004.
For the butterfly fish data:
- _________ What level of measurement is the data?
- _________ Determine the sample size n.
- _________ Calculate the sample mean
x.
- _________ Determine the median.
- _________ Determine the mode.
- _________ Determine the minimum.
- _________ Determine the maximum.
- _________ Calculate the range.
- _________ Calculate the sample standard deviation sx.
- _________ Calculate the sample Coefficient of Variation.
- _________ Determine the class width. Use 5 bins (classes or intervals)
- Fill in the following table with the class upper limits in the first column, the frequencies in the second column, and the relative frequencies in the third column
| Bins | Frequency | Relative Frequency f/n |
|---|
| _________ | _________ | _________ |
| _________ | _________ | _________ |
| _________ | _________ | _________ |
| _________ | _________ | _________ |
| _________ | _________ | _________ |
|
Sums: | _________ | _________ |
- Sketch a histogram of the relative frequency data on the back of the paper.
- __________________ What is the shape of the distribution?
- Construct a 95% confidence interval for the population mean μ count of butterfly fish per 25 meters. Note that n is less than 30. Use the sample size, sample mean and sample standard deviation from questions two, three, and nine above to generate your t-critical tc and error tolerance E.
- __________ What is the point estimate for the population mean μ?
- df = __________ How many degrees of freedom?
- tc = __________ What is tc?
- The error tolerance E = _______________
- The 95% confidence interval for the count of butterfly fish per 25 meters μ is ____________ ≤ μ ≤ ____________
- The number of butterfly fish per 25 meters in 2004 appears to be different from the other surveys. Use the sample mean found in question three as the population mean μ. The 2004 data has a sample size n of 4, a sample mean
x of 12, and a sample standard deviation of 6.8. Perform a hypothesis test using these values from the 2004 data. Test the hypothesis that the 2004 sample mean
x of 12 represents a statistically significant change from the population from the population mean μ found in question three at a significance level of 5%. Note that n is 4, technically less than the required minimum of 5, but go ahead and do the hypothesis test using this n.
- Write the null hypothesis:
- Write the alternate hypothesis:
- Write down the level of significance. alpha α = __________
- Determine tc. tc = __________
- Calculate the t-statistic. t = __________
- Determine the p-value using the t-distribution. p = __________
- __________ What is the largest confidence interval c for which this difference is statistically significant?
- ________________________________________ Would we reject the null hypothesis or fail to reject the null hypothesis that the butterfly fish mean for 2004 is statistically significantly different from the mean in question three at a 5% level of significance?
- __________ If we reject the null hypothesis, what is the risk of a type I error based on the p-value?
- __________ If we had chosen to use an alpha α = 0.01, would the difference between the 2004 sample mean butterfly fish count of 12 and the population mean butterfly fish count from question three have been significant?
Part Two: Regression and Correlation
| Butterfly | Coral |
|---|
| 4 | 8 |
| 5 | 15 |
| 17 | 9 |
| 7 | 12 |
| 5 | 13 |
| 14 | 23 |
| 12 | 21 |
| 18 | 18 |
| 4 | 18 |
| 6 | 28 |
| 9 | 26 |
| 11 | 23 |
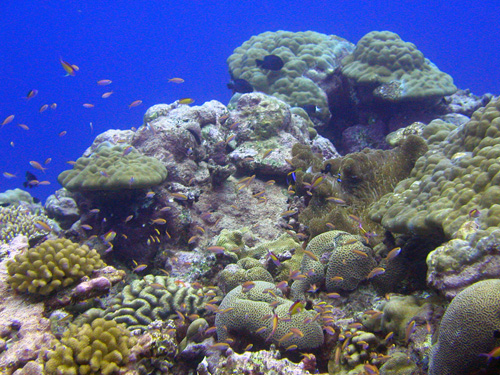
Part two explores whether there is a relationship between butterfly fish counts and hard coral counts per 25 meters at Metais EMB#53. This investigates whether butterfly fish counts are correlated to hard coral counts. Put more directly, do butterfly fish hang around hard coral? The first column of the table is the count of butterfly fish per 25 meters at Metais. The second column is the count of hard coral per 25 meters at Metais.
- _________ Calculate the slope of the best fit (least squares) line for the data.
- _________ Calculate the y-intercept of the best fit (least squares) line.
- _________ Is the correlation positive, negative, or neutral?
- _________ Use the equation of the best fit line to calculate the predicted count of hard coral for a count of 15 butterfly fish.
- _________ Use the inverse of the best fit line to calculate the predicted butterfly fish count for a count of 18 hard coral.
- _________ Calculate the linear correlation coefficient r for the data.
- _________ Is the correlation none, low, moderate, high, or perfect?
- _________ Calculate the coefficient of determination.
- _________ What percent of the variation in the butterfly fish data explains the variation in the hard coral data?
- _________ Is there a relationship between the butterfly fish and the hard coral data?
- _________ Can we accurately predict the number of butterfly fish from a hard coral count?
Why or why not?