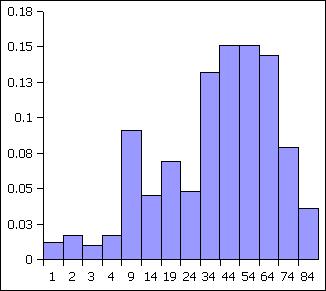
| Age bins (upper limit on age) | Frequency f | Relative Frequency or P(x) | x*P(x) |
| 1 | 5 | 0.01 | 0.01 |
| 2 | 7 | 0.02 | 0.03 |
| 3 | 4 | 0.01 | 0.03 |
| 4 | 7 | 0.02 | 0.07 |
| 9 | 38 | 0.09 | 0.82 |
| 14 | 19 | 0.05 | 0.64 |
| 19 | 29 | 0.07 | 1.32 |
| 24 | 20 | 0.05 | 1.15 |
| 34 | 55 | 0.13 | 4.47 |
| 44 | 63 | 0.15 | 6.63 |
| 54 | 63 | 0.15 | 8.14 |
| 64 | 60 | 0.14 | 9.19 |
| 74 | 33 | 0.08 | 5.84 |
| 84 | 15 | 0.04 | 3.01 |
| 418 | 1 | 41.35 | |
| 2 | 418 | ||
| 3 | 59 | ||
| 4 | skewed left | ||
| 5 | 9.09% | ||
| 6 | 41.35 | ||
| 7 | higher | ||
| 8 | Higher mean age 1946: longer lifespan | ||
| No NCDs: lifestyle diseases | |||
| Reduced number of babies: possibly a | |||
| result of chiefs making pop control | |||
| decisions during WWII | |||
|
|
|||