MS 150 Statistics Worksheet 8.1 • Name: _______________
| Year |
Max (mm) |
| 1953 |
122 |
| 1954 |
154 |
| 1955 |
157 |
| 1956 |
122 |
| 1957 |
559 |
| 1958 |
175 |
| 1959 |
159 |
| 1960 |
116 |
| 1961 |
166 |
| 1962 |
134 |
| 1963 |
111 |
| 1964 |
163 |
| 1965 |
180 |
| 1966 |
93 |
| 1967 |
141 |
| 1968 |
226 |
| 1969 |
120 |
| 1970 |
107 |
| 1971 |
145 |
| 1972 |
177 |
| 1973 |
133 |
| 1974 |
121 |
| 1975 |
183 |
| 1976 |
254 |
| 1977 |
208 |
| 1978 |
95 |
| 1979 |
165 |
| 1980 |
181 |
| 1981 |
96 |
| 1982 |
233 |
| 1983 |
163 |
| 1984 |
79 |
| 1985 |
143 |
| 1986 |
113 |
| 1987 |
187 |
| 1988 |
133 |
| 1989 |
150 |
| 1990 |
230 |
| 1991 |
201 |
| 1992 |
244 |
| 1993 |
107 |
| 1994 |
182 |
| 1995 |
203 |
| 1996 |
118 |
| 1997 |
247 |
| 1998 |
114 |
| 1999 |
129 |
| 2000 |
179 |
| 2001 |
131 |
| 2002 |
179 |
Tropical Storm 02W (Kujira) dropped 324 mm of rain on Pohnpei within a 24 hour period between Wednesday 09 April and Thursday 10 April 2003. Is that a typical maximum 24-hour rainfall for any given year? In other words, on a historic basis was that rainfall unusually heavy? The data table shows the maximum 24 hour rainfall in each year.
Note that we are not working with mean values. This means that to construct a confidence interval for this data requires that the data be normally distributed. Although this is not actually true, we will proceed with an analysis as if the data was normally distributed just to practice calculating a confidence interval.
- _______ What is the sample size n?
- _______ What is the mean for the maximum annual rainfall x?
- _______ What is the sample standard deviation sx for the mean maximum annual rainfall?
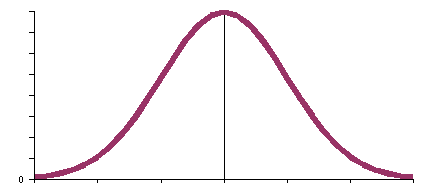
- Create a sketch of for this data:
- _______ What is c if we want to calculate a 95% confidence interval?
- _______ How many degrees of freedom df are there in this problem?
- _______ Calculate t-critical tc from =TINV(1-c,n-1)
- _______ Calculate the Error E using tc*sx. IMPORTANT: This time we are NOT working with an average. The 324 mm is a SINGLE day amount of rain, not an average over many days. This means the error is simply tc*sx. We are calculating a 95% interval within which we expect any one day's worth of data to fall. As a result we do not use the square root of n in the denominator.
- _________ < µ < _________ Use the Error E calculated above to calculate the 95% confidence interval from x - E < µ < x + E.
- The confidence interval for the population mean µ is:
P( _________ < µ < _________ ) = _________
- _________ Is the 324 mm one day rain event generated by 02W (Kujira) unusual on an annual basis?
- If we could determine the largest confidence level c that just includes the 324 mm value, we would have an estimate of the rarity of the event by looking at the tail of that largest confidence interval. If one calculates (x - x)/sx, or (324 - mean)/stdev, the result is a z value. We call this value a z-statistic, or, if we are intending to work with t, we call this a t-statistic. Calculate the t-statistic: ___________
If we were working with means, which we are NOT today, we would use  to calculate the t-statistic.
- The t-statistic represents the location of the x value on the t-distribution. It is the largest possible confidence interval. We can determine the area in the tails beyond -t-statistic and +t-statistic (1 - c) from:
=TDIST(ABS(tstat),degrees of freedom,number of tails)
or for confidence intervals which always have two tails:
=TDIST(ABS(tstat),degrees of freedom,2)
where ABS calculates the absolute value of the t-statistic. TDIST can accept only positive values for the t-statistic. TDIST: ___________
- ___________ Calculate 1 - TDIST to determine the largest confidence level. We can be 1-TDIST certain that this not an average annual event. 02W was something special...