Part One

The number of new orange centerline reflectors was counted by a three person team. The counts are the number of markers for each half kilometer.

Number of
centerline markers
per half kilometer
84
74
78
61
67
55
53
62
61
83
81
75
70
65
70
76
  1. For the number of centerline markers per half kilometer:

    _________ Determine the sample size n.
  2. _________ Calculate the sample mean x.
  3. _________ Determine the median.
  4. _________ Determine the mode.
  5. _________ Determine the minimum.
  6. _________ Determine the maximum.
  7. _________ Calculate the range.
  8. _________ Calculate the sample standard deviation sx for the tonnage of the skipjack.
  9. _________ Calculate the sample Coefficient of Variation for the tonnage of skipjack.
  10. _________ Determine the class width for the skipjack tonnage. Use 5 bins (classes or intervals)
  11. Fill in the following table with the class upper limits in the first column, the frequencies in the second column, and the relative frequencies in the third column
    Bins Frequency Relative Frequency f/n
    _________ _________ _________
    _________ _________ _________
    _________ _________ _________
    _________ _________ _________
    _________ _________ _________
    Sums: _________ _________
  12. Sketch a histogram of the relative frequency data to the right of the table above.
  13. _________ What is the shape of the distribution?
  14. _________ Using the relative frequencies in the table above, what is the probability that the tonnage of skipjack in any given year will be about 14,700 some tonnes or more for FSM owned boats?
  15. Construct a 95% confidence interval for the population mean µ skipjack tonnage for FSM owned purse seiner boats using the above data. Note that n is less than 30. Use the sample mean and sample standard deviation to generate your error tolerance E.
    1. __________ How many degrees of freedom?
    2. __________ What is tc?
    3. The error tolerance E = _______________
    4. The 95% confidence interval for µ is ____________ < µ < ____________
  16. __________ Based on your confidence interval calculations above, if FSM owned purse seiners caught 10,310 tonnes in 2001, would this change in the tonnage be statistically significant at an alpha of 0.05?
  17. __________ Calculate the two-tail p-value using a t-statistic based on the sample size in question one, the sample mean in number two, the sample standard deviation in question eight, and the above 10,310 tonne mean. Treat the sample mean in question two as if it were a population mean µ for the purposes of the calculation.
  18. __________ Use the p-value in the above question to calculate and report the largest confidence level for which the change would be significant.

The data below represents the catch per unit effort for skipjack tuna caught by FSM owned purse seiners from 1992 to 2001. The catch per unit effort (CPUE) is the total tonnage of tuna caught divided by the total numbers of days fished and searched. In the table below 1992 is the "base year". 1992 is year 0, 1993 is year 1, 1994 is year 2, and so forth with 2001 being year 9. 2002 would be year 10 in this system.

YearSkipjack CPUE
014.67
110.14
211.72
38.62
414.32
59.76
615.59
712.36
817.33
911.99
  1. _________ Determine the sample size n for the skipjack CPUE.
  2. _________ Calculate the sample mean for the skipjack CPUEx.
  3. _________ Determine the median for the skipjack CPUE.
  4. _________ Determine the mode for the skipjack CPUE.
  5. _________ Determine the minimum for the skipjack CPUE.
  6. _________ Determine the maximum for the skipjack CPUE.
  7. _________ Calculate the range for the skipjack CPUE.
  8. _________ Calculate the sample standard deviation sx for the skipjack CPUE.
  9. _________ Calculate the sample Coefficient of Variation for the skipjack CPUE.
  10. _________ Calculate the slope of the best fit (least squares) line for the data.
  11. _________ Calculate the y-intercept of the least squares line.
  12. _________ Is the correlation positive, negative, or neutral?
  13. _________ Use the equation of the best fit line to calculate the projected skipjack CPUE for 2003 (year 11 in the system used above).
  14. _________ Use the inverse of the best fit equation of the best fit line to calculate the expected year in which the CPUE might be expected to reach 18.
  15. _________ Calculate the linear correlation coefficient r for the data.
  16. _________ Is the correlation none, low, moderate, high, or perfect?
  17. _________ Calculate the coefficient of determination.
  18. _________ What percent of the variation in the year data explains the variation in the CPUE data?
  19. _________ Is there a relationship between the year and the CPUE?
  20. _________ The FSM purse seiner fleet is a "young" fleet. Based on the data above, are the boats and their crews becoming better purse seiners with the passing of the years?
  21. Basic Statistics
    Statistic or Parameter Symbol Equations Excel
    Square root     =SQRT(number)
    Sample size n   =COUNT(data)
    Sample mean x Sx/n =AVERAGE(data)
    Sample standard deviation sx or s sampstdev.gif (1072 bytes) =STDEV(data)
    Sample Coefficient of Variation CV 100(sx/x) =100*STDEV(data)/AVERAGE(data)
    Linear Regression Statistics
    Statistic or Parameter Symbol Equations Excel
    Slope b   =SLOPE(y data, x data)
    Intercept a   =INTERCEPT(y data, x data)
    Correlation r   =CORREL(y data, x data)
    Coefficient of Determination r2   =(CORREL(y data, x data))^2
    Statistic or Parameter Symbol Equations Excel
    Normal Statistics
    Calculate a z value from an x z = standardize.gif (905 bytes) =STANDARDIZE(x, µ, s)
    Calculate an x value from a z x = s z + µ =s*z+µ
    Calculate a z-statistic from an x z xbartoz.gif (1022 bytes) =(x - µ)/(sx/SQRT(n))
    Calculate a t-statistic (t-stat) t xbartot.gif (1028 bytes) =(x - µ)/(sx/SQRT(n))
    Calculate an x from a z   xbarfromz.gif (1060 bytes) =µ + zc*sx/sqrt(n)
    Find a probability p from a z value     =NORMSDIST(z)
    Find a z value from a probability p     =NORMSINV(p)
    Confidence interval statistics
    Degrees of freedom df = n-1 =COUNT(data)-1
    Find a zc value from a confidence level c zc   =ABS(NORMSINV((1-c)/2))
    Find a tc value from a confidence level c tc   =TINV(1-c,df)
    Calculate an error tolerance E of a mean for n >= 30 using sx E error_tolerance_zc.gif (989 bytes) =zc*sx/SQRT(n)
    Calculate an error tolerance E of a mean for n < 30 using sx. Can also be used for n >= 30. E error_tolerance_tc.gif (989 bytes) =tc*sx/SQRT(n)
    Calculate a confidence interval for a population mean µ from a sample mean x and an error tolerance E   x-E<= µ <=x+E  
    Hypothesis Testing
    Calculate t-critical for a two-tailed test tc   =TINV(a,df)
    Calculate a p-value from a t-statistic p   = TDIST(ABS(tstat),df,#tails)

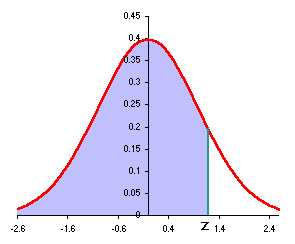
    Standard normal cumulative distribution left to z or to t as used by Excel functions