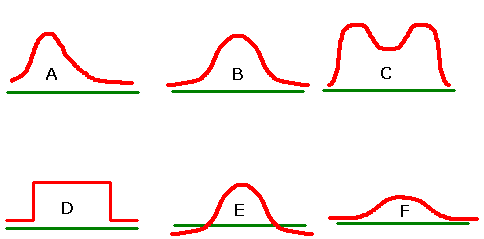
Which, if any, of the curves in the figure above look(s) like a normal curve? If the curve is a NOT normal curve, tell why.

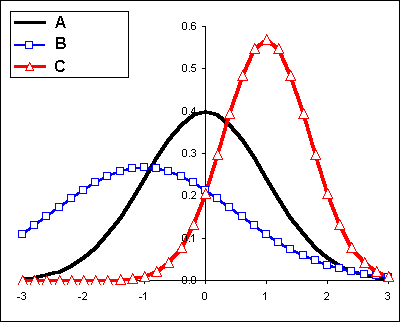
- _______ Which curve has the smallest mean?
- _______ Which curve has the smallest standard deviation?
- _______ What is the mean for curve A?
- _______ What is the apparent mean for curve B?
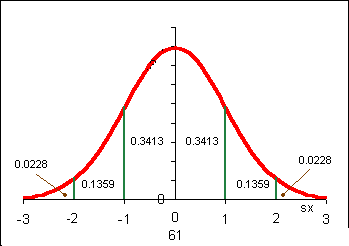
 I jog from the College to Kolonia in a mean time µ = 61 minutes with a standard deviation s = 7 minutes. My times are normally distributed about the mean.
- _______ What is the probability that a run will take less than 61 minutes?
- _______ What is the probability that a run will take more than 68 minutes?
- _______ If I run 50 runs home during 2001, how many runs would be expected to last between 54 minutes and 68 minutes?
