Part One

Aside from money received from the United States of America through the Compact of Free Association, the other major contributor to the Gross National Product of the Federated States of Micronesia is fisheries, primarily tuna fisheries. The largest tonnages are for skipjack tuna caught by purse seiners for the canned tuna market. Many nations have boats involved in skipjack purse seiner fisheries. From 1992 to 2000 the total tonnage of skipjack tuna caught by FSM owned purse seiners was as follows:

YearSkipjack/tonnesYearSkipjack/tonnes
19921165719975501
199311692199811314
19941735119996972
19954216200015843
19966745
  1. _________ Determine the sample size n tonnage of skipjack.
  2. _________ Calculate the sample mean tonnage of skipjack x.
  3. _________ Determine the median tonnage of skipjack.
  4. _________ Determine the mode for the tonnage of skipjack.
  5. _________ Determine the minimum tonnage of skipjack.
  6. _________ Determine the maximum tonnage of skipjack.
  7. _________ Calculate the range for the tonnage of skipjack.
  8. _________ Calculate the sample standard deviation sx for the tonnage of the skipjack.
  9. _________ Calculate the sample Coefficient of Variation for the tonnage of skipjack.
  10. _________ Determine the class width for the skipjack tonnage. Use 5 bins (classes or intervals)
  11. Fill in the following table with the class upper limits in the first column, the frequencies in the second column, and the relative frequencies in the third column
    Bins Frequency Relative Frequency f/n
    _________ _________ _________
    _________ _________ _________
    _________ _________ _________
    _________ _________ _________
    _________ _________ _________
    Sums: _________ _________
  12. Sketch a histogram of the relative frequency data to the right of the table above.
  13. _________ What is the shape of the distribution?
  14. _________ Using the relative frequencies in the table above, what is the probability that the tonnage of skipjack in any given year will be about 14,700 some tonnes or more for FSM owned boats?
  15. Construct a 95% confidence interval for the population mean µ skipjack tonnage for FSM owned purse seiner boats using the above data. Note that n is less than 30. Use the sample mean and sample standard deviation to generate your error tolerance E.
    1. __________ How many degrees of freedom?
    2. __________ What is tc?
    3. The error tolerance E = _______________
    4. The 95% confidence interval for µ is ____________ < µ < ____________
  16. __________ Based on your confidence interval calculations above, if FSM owned purse seiners caught 10,310 tonnes in 2001, would this change in the tonnage be statistically significant at an alpha of 0.05?
  17. __________ Calculate the two-tail p-value using a t-statistic based on the sample size in question one, the sample mean in number two, the sample standard deviation in question eight, and the above 10,310 tonne mean. Treat the sample mean in question two as if it were a population mean µ for the purposes of the calculation.
  18. __________ Use the p-value in the above question to calculate and report the largest confidence level for which the change would be significant.

Part Two

The data below represents the catch per unit effort for skipjack tuna caught by FSM owned purse seiners from 1992 to 2001. The catch per unit effort (CPUE) is the total tonnage of tuna caught divided by the total numbers of days fished and searched. In the table below 1992 is the "base year". 1992 is year 0, 1993 is year 1, 1994 is year 2, and so forth with 2001 being year 9. 2002 would be year 10 in this system.

YearSkipjack CPUE
014.67
110.14
211.72
38.62
414.32
59.76
615.59
712.36
817.33
911.99
  1. _________ Calculate the slope of the best fit (least squares) line for the data.
  2. _________ Calculate the y-intercept of the least squares line.
  3. _________ Is the correlation positive, negative, or neutral?
  4. _________ Use the equation of the best fit line to calculate the projected skipjack CPUE for 2002 (year 10 in the system used above).
  5. _________ Use the inverse of the best fit equation of the best fit line to calculate the expected year in which the CPUE might be expected to reach 18.
  6. _________ Calculate the linear correlation coefficient r for the data.
  7. _________ Is the correlation none, low, moderate, high, or perfect?
  8. _________ Calculate the coefficient of determination.
  9. _________ What percent of the variation in the year data explains the variation in the CPUE data?
  10. _________ Is there a relationship between the year and the CPUE?
  11. _________ The FSM purse seiner fleet is a "young" fleet. Based on the data above, are the boats and their crews becoming better purse seiners with the passing of the years?
  12. One might imagine that the FSM purse seiner fleet operates primarily in the waters of the FSM. This is not the case. On the contrary, most of the skipjack, yellowfin, and bigeye tuna is caught in the waters of the Republic of the Marshall Islands (RMI), Nauru, Kiribati, and the international waters between the FSM and Papua New Guinea. Only a small portion of the catch comes from the waters South of Pohnpei and around Kosrae. In the following chart the FSM is at the upper left corner, the solid circles show where the tuna was actually caught by FSM owned purse seiners. The lines are the Extended Economic Zone (EEZ) boundaries, 200 nautical miles from shore.
    fsm_purseseinercatch_2001 (40K)
    A similar pattern is seen in the high cash-value catches of tuna by FSM owned long liners for export as sashimi:
    fsm_longlinecatch_2001 (32K)
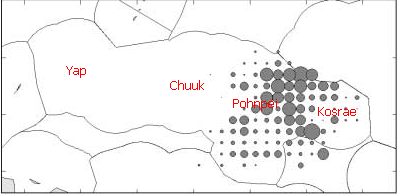
    Here the FSM is at the center of the diagram.
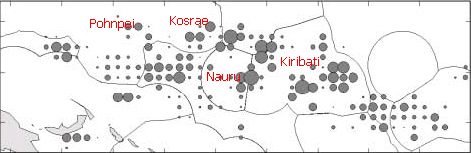
    Similar patterns of tuna catches are seen for boats from Japan, China, and Taiwan. Over the past five years some states, notably Kosrae and Yap, and some portions of existing states, notably Faichuuk, have engaged in internal discussions about the possibility of declaring themselves independent nations. More recently the individual states have pushed for changes to the constitution that would ensure that money earned from tuna would go to the state in which the tuna was caught (this presumes that the state could somehow "own" its portion of the national Exteneded Economic Zone). Whether pursuing independence or seeking constitutional change, a key factor in obtaining income would be whether tuna is actually caught in that state. Based on the actual patterns of tuna catches, which states would get money from tuna and which states would not?

    States that would get the tuna money:

    States that would not get tuna money:
Basic Statistics
Statistic or Parameter Symbol Equations Excel
Square root     =SQRT(number)
Sample size n   =COUNT(data)
Sample mean x Sx/n =AVERAGE(data)
Sample standard deviation sx or s sampstdev.gif (1072 bytes) =STDEV(data)
Sample Coefficient of Variation CV 100(sx/x) =100*STDEV(data)/AVERAGE(data)
Linear Regression Statistics
Statistic or Parameter Symbol Equations Excel
Slope b   =SLOPE(y data, x data)
Intercept a   =INTERCEPT(y data, x data)
Correlation r   =CORREL(y data, x data)
Coefficient of Determination r2   =(CORREL(y data, x data))^2
Statistic or Parameter Symbol Equations Excel
Normal Statistics
Calculate a z value from an x z = standardize.gif (905 bytes) =STANDARDIZE(x, µ, s)
Calculate an x value from a z x = s z + µ =s*z+µ
Calculate a z-statistic from an x z xbartoz.gif (1022 bytes) =(x - µ)/(sx/SQRT(n))
Calculate a t-statistic (t-stat) t xbartot.gif (1028 bytes) =(x - µ)/(sx/SQRT(n))
Calculate an x from a z   xbarfromz.gif (1060 bytes) =µ + zc*sx/sqrt(n)
Find a probability p from a z value     =NORMSDIST(z)
Find a z value from a probability p     =NORMSINV(p)
Confidence interval statistics
Degrees of freedom df = n-1 =COUNT(data)-1
Find a zc value from a confidence level c zc   =ABS(NORMSINV((1-c)/2))
Find a tc value from a confidence level c tc   =TINV(1-c,df)
Calculate an error tolerance E of a mean for n >= 30 using sx E error_tolerance_zc.gif (989 bytes) =zc*sx/SQRT(n)
Calculate an error tolerance E of a mean for n < 30 using sx. Can also be used for n >= 30. E error_tolerance_tc.gif (989 bytes) =tc*sx/SQRT(n)
Calculate a confidence interval for a population mean µ from a sample mean x and an error tolerance E   x-E<= µ <=x+E  
Hypothesis Testing
Calculate t-critical for a two-tailed test tc   =TINV(a,df)
Calculate a p-value from a t-statistic p   = TDIST(ABS(tstat),df,#tails)

Standard normal cumulative distribution left to z or to t as used by Excel functions

Statistics · Lee Ling courses · COM-FSM