MS 150 Statistics Quiz 02 Spring 2002
|
Speed in meters per second |
| Dolon Pass |
2.75 |
| Turn-off for Nahnpohnmal |
4.00 |
| Bottom of the beast |
2.50 |
| Top of the beast |
2.22 |
| Track West |
3.09 |
| PICS |
6.67 |
For the above data:
- __________ Calculate the sample mean
 :
:
- __________ Calculate the sample standard deviation sx
- __________ Calculate the Coefficient of Variation

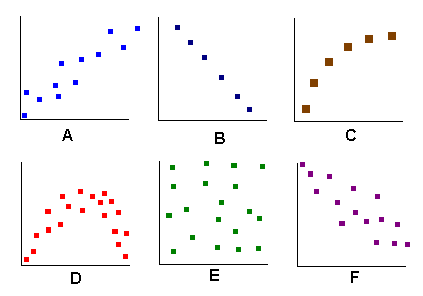
- ____________ Which of the above graph(s) depict a relationship that is linear (list all
of the letters that apply)?
- ____________ Which of the above graph(s) depict a relationship that is non-linear?
- ____________ Which of the above graph(s) depict no relationship?
- ____________ Which of the above graph(s) depict a relationship that is negative linear
relationship?
- ____________ Which of the above graph(s) depict a relationship that is a perfect linear
relationship?
