Part One

Between 21 July to 01 August the Fifth Micronesian Games 2002 will convene on Pohnpei. The games will include distance running such as the half-marathon. Distance runners have to pace themselves in order to win. If they run too fast they will tire and be unable to finish the race. If they run too slow they will not run the fastest race they could and will probably lose. They have to run exactly as fast as their maximum sustainable effort for the distance. As a result runners carefully track their running times and their pace. They also strive for consistency in pace. Below are the times for Lee Ling's most recent ten runs from the College to his home in Dolihner, a distance of about six miles. The times are in minutes.

Duration of run in minutes
54.0063.00
54.6463.93
57.3564.17
58.0070.00
62.6274.00
  1. _________ Determine the sample size n.
  2. _________ Calculate the sample mean x.
  3. _________ Determine the median.
  4. _________ Determine the mode.
  5. _________ Determine the minimum.
  6. _________ Determine the maximum.
  7. _________ Calculate the range.
  8. _________ Calculate the sample standard deviation sx.
  9. _________ Calculate the Coefficient of Variation.
  10. _________ Determine the class width. Use 5 bins (classes or intervals)
  11. Fill in the following table with the class upper limits in the first column, the frequencies in the second column, and the relative frequencies in the third column
    Bins Frequency Relative Frequency f/n
    _________ _________ _________
    _________ _________ _________
    _________ _________ _________
    _________ _________ _________
    _________ _________ _________
    Sums: _________ _________
  12. Sketch a histogram of the relative frequency data to the right of the table above.
  13. _________ What is the shape of the distribution?
  14. _________ Based on the data above, what is the probability that Lee Ling will require 70 or more minutes to reach home from the College?
  15. Construct a 95% confidence interval for the population mean µ time for Lee Ling to run home using the above data. Note that n is less than 30. Use the sample mean and sample standard deviation to generate your error tolerance E. Show all of your work either below or on the back of this sheet.
    1. __________ How many degrees of freedom?
    2. __________ What is tc?
    3. The error tolerance E = _______________
    4. The 95% confidence interval for µ is ____________ < µ < ____________
  16. __________ Based on your confidence interval calculations above, if Lee Ling averages 68 minutes for his runs home for the rest of this year, would this change in the mean time to run home be statistically significant at an alpha of 0.05?
  17. __________ Calculate the two-tail p-value using a t-statistic based on the sample size in question one, the sample mean in number two, the sample standard deviation in question eight, and the above 68 minute mean. Treat the 68 minute average time in the above question as if it were a population mean µ.
  18. Use the p-value in the above question to calculate and report the largest confidence level for which the change would be significant.

Part Two

The table below is a distance versus time table for a single run from the College to Dolihner.

LocationTime in minDistance in km
College0.00.0
Dolon pass18.23.3
West Bridge (Pent)24.94.6
East Bridge (SSC)30.05.6
Sokehs Island Jxn47.28.6
Dolihner54.o9.7
  1. _________ Calculate the slope of the least squares line for the data.
  2. _________ Calculate the y-intercept of the least squares line.
  3. _________ Is the correlation positive, negative, or neutral?
  4. _________ Use the equation of the best fit line to calculate the expected distance after 40 minutes of running.
  5. _________ Use the inverse of the best fit equation of the best fit line to calculate the expected time to run five kilometers.
  6. _________ Calculate the linear correlation coefficient r for the data.
  7. _________ Is the correlation none, low, moderate, high, or perfect?
  8. _________ Calculate the coefficient of determination.
  9. _________ What percent of the variation in the distance date explains the time data?
  10. _________ Is there a relationship between distance and time?
  11. _________ About how long in minutes would it take this runner to run 10 kilometers?
  12. Could the best fit line data be used to calculate the length of time for the runner to complete a half-marathon (21.1 kilometers)?
    • Why or why not?
Basic Statistics
Statistic or Parameter Symbol Equations Excel
Square root     =SQRT(number)
Sample size n   =COUNT(data)
Sample mean x Sx/n =AVERAGE(data)
Sample standard deviation sx or s sampstdev.gif (1072 bytes) =STDEV(data)
Sample Coefficient of Variation CV 100(sx/x) =100*STDEV(data)/AVERAGE(data)
Linear Regression Statistics
Statistic or Parameter Symbol Equations Excel
Slope b   =SLOPE(y data, x data)
Intercept a   =INTERCEPT(y data, x data)
Correlation r   =CORREL(y data, x data)
Coefficient of Determination r2   =(CORREL(y data, x data))^2
Statistic or Parameter Symbol Equations Excel
Normal Statistics
Calculate a z value from an x z = standardize.gif (905 bytes) =STANDARDIZE(x, µ, s)
Calculate an x value from a z x = s z + µ =s*z+µ
Calculate a z-statistic from an x z xbartoz.gif (1022 bytes) =(x - µ)/(sx/SQRT(n))
Calculate a t-statistic (t-stat) t xbartot.gif (1028 bytes) =(x - µ)/(sx/SQRT(n))
Calculate an x from a z   xbarfromz.gif (1060 bytes) =µ + zc*sx/sqrt(n)
Find a probability p from a z value     =NORMSDIST(z)
Find a z value from a probability p     =NORMSINV(p)
Confidence interval statistics
Degrees of freedom df = n-1 =COUNT(data)-1
Find a zc value from a confidence level c zc   =ABS(NORMSINV((1-c)/2))
Find a tc value from a confidence level c tc   =TINV(1-c,df)
Calculate an error tolerance E of a mean for n >= 30 using sx E error_tolerance_zc.gif (989 bytes) =zc*sx/SQRT(n)
Calculate an error tolerance E of a mean for n < 30 using sx. Can also be used for n >= 30. E error_tolerance_tc.gif (989 bytes) =tc*sx/SQRT(n)
Calculate a confidence interval for a population mean µ from a sample mean x and an error tolerance E   x-E<= µ <=x+E  
Hypothesis Testing
Calculate t-critical for a two-tailed test tc   =TINV(a,df)
Calculate a p-value from a t-statistic p   = TDIST(ABS(tstat),df,#tails)

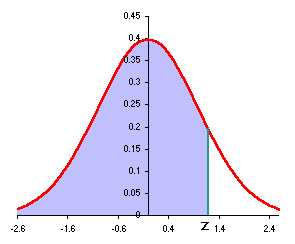
Standard normal cumulative distribution left to z or to t as used by Excel functions

Statistics Lee Ling courses COM-FSM