MS 150 Statistics Spring 2001 Quickie Quiz Six
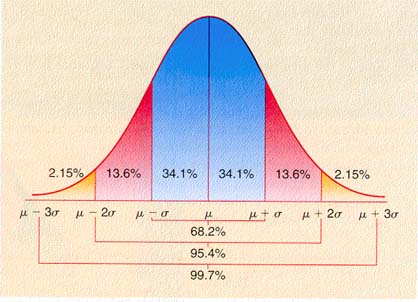
- What is the shape of the above curve?
- For normally distributed data, what is the probability that the data will be between the
mean minus one standard deviation and the mean plus one standard deviation?
- For normally distributed data, what is the probability that the data will be more than
one standard deviation above the mean?
- For a test with normally distributed scores and a mean m of
47 and a standard deviation s of 11, what is the probability a
given score will be between 36 and 58?
- Assume that the arrival times of customers at Dolokei-Palipoa sakau market on a Friday
evening are normally distributed with a mean m of 7:00 P.M. and
a population standard deviation s of 30 minutes. What
percentage of customers have arrived by 7:00 P.M. or earlier?
Lee Ling home
COM-FSM home page