Quickie Quiz 3
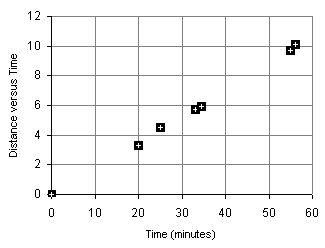
The data and graph is of a runner running from the College campus up to Bailey Olter
High School via the back road past the powerplant in Nahnpohnmal. The x data is the
time in minutes, the y data is the distance in kilometers. Use either your
calculator or Excel to perform the calculations.
| Time x (minutes) |
Distance y (km) |
| 0 |
0 |
| 20 |
3.3 |
| 25 |
4.5 |
| 33 |
5.7 |
| 34.5 |
5.9 |
| 55 |
9.7 |
| 56 |
10.1 |

- Find the sample standard deviation for the time data.
- What is the correlation for the data?
- perfect negative correlation
- highly negative correlation
- moderately negative correlation
- no correlation
- moderately positive correlation
- highly positive correlation
- perfect positive correlation
- The slope of the least squares regression line is the average pace of the runner.
Determine and write down the slope of the least squares regression line.
- The Pearson product-moment correlation coefficient represents how well the runner held a
fairly constant pace during the run. A perfect correlation would be constant pace, a
high correlation would represent a fairly constant pace. Calculate the Pearson
product-moment correlation coefficient r.
- Determine the coefficient of determination.
Lee Ling home
COM-FSM home page

