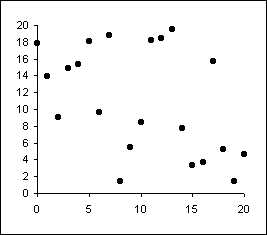
1. Is there a relationship between these two variables? _____________
2. Is there a linear relationship between these two variables? __________
3. What is the degree of the relationship (perfect, high, moderate, low, or none)?
____________________________
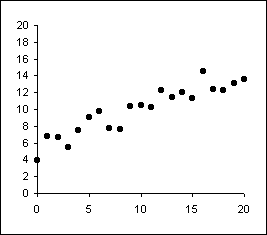
4. Is there a relationship between these two variables? _____________
5. Is there a linear relationship between these two variables? __________
6. What is the degree of the relationship (perfect, high, moderate, low, or none)?
____________________________
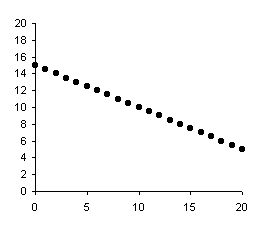
7. Is there a relationship between these two variables? _____________
8. Is there a linear relationship between these two variables? __________
9. What is the degree of the relationship (perfect, high, moderate, low, or none)?
____________________________
10. Is this a positive or negative relationship? ___________________
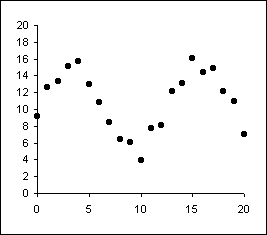
11. Is there a relationship between these two variables? _____________
12. Is there a linear relationship between these two variables? __________
13. What is the degree of the relationship (perfect, high, moderate, low, or none)?
____________________________
